The S&P 500 index crashed below key support levels as the CBOE volatility index (VIX) rose and the fear and greed index crashed to 21. The index ended the day at $4,357, which was more than 4% below the highest level this week.
Fear and greed index and VIX
The fear and greed index is a tool that was developed by CNN Money to show the sentiment in the market. Over the years, the index has become an ideal gauge about the sentiment in the market. The index has dropped to the extreme fear of 21, which is substantially below last week’s high of almost 40.
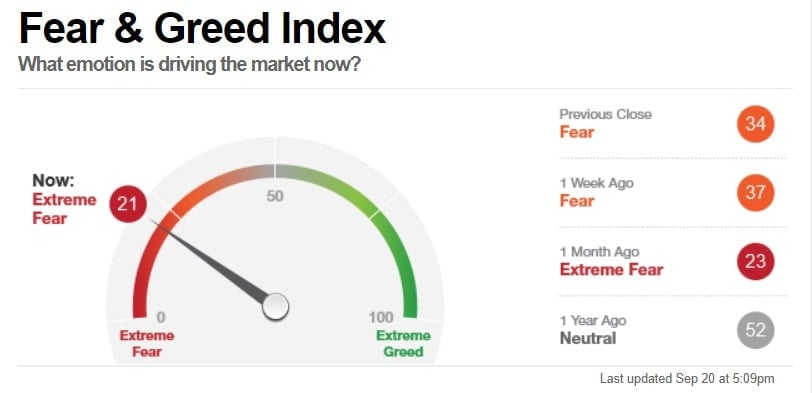
A closer look at its sub-indexes shows that most of them are in the extreme fear zone. For example, the VIX index jumped sharply on Monday and is in extreme fear. Others in the region are put and call options, safe-haven demand, stock price breadth, and stock price strength. Market momentum is in the extreme fear zone while junk bond demand is in the greed zone.
The reasons behind this fear are well-known. There are risks of Evergrande, the second-biggest Chinese real estate company. In a report released on Monday, S&P Global Ratings predicted that the company will likely default on its obligations.
There are also risks of the rising energy prices, hawkish Federal Reserve, and the potential for a hawkish Federal Reserve in this week’s meeting.
Still, fundamentally, these issues don’t have a major impact on American equities and the S&P 500. First, Evergrande does not have a major exposure to American firms. Besides, its problems have been in public knowledge for years. Second, the actions by the Federal Reserve are already known and priced in. Finally, the chances of an American default are relatively narrow.
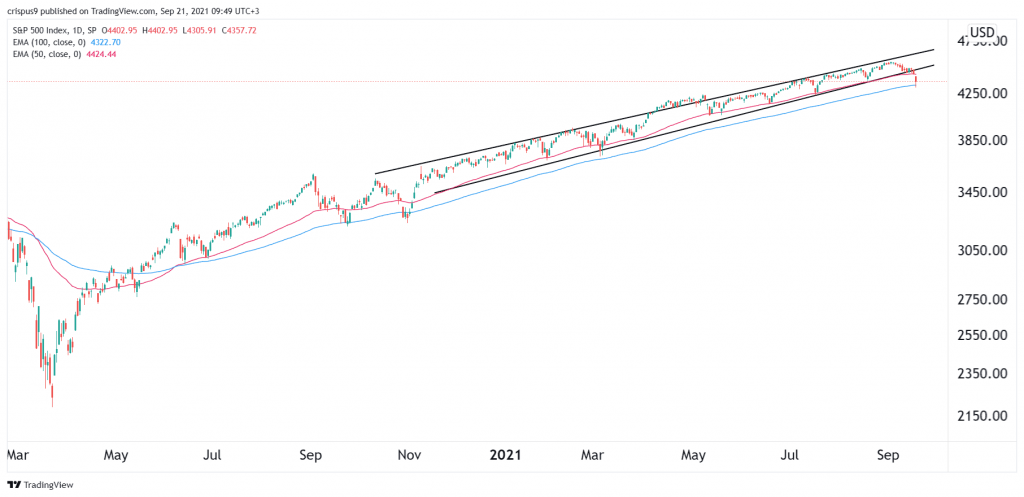
S&P 500 index forecast
The S&P 500 index does not have an ideal technical arrangement. For one, the index’s bullish momentum has moderated in the past few days. Also, it has formed an ascending wedge pattern that is usually a bearish signal.
Notably, the index has moved below the 50-day EMA. A closer look shows that the index has moved below that average several times before. Still, it remains slightly above the 100-day moving averages.
Therefore, traders should focus on the 100-day EMA for any further cues. A volume-supported drop below this key level will be a bearish signal. On the other hand, the bullish trend will remain so long as the price is above the 100-day EMA.