- The best stocks to buy now share strong fundamentals, including a PEG ratio under 1.5, ROE above 20%, low debt-to-equity (below 1), and consistent EPS growth above 15%.
- Positive analyst ratings strengthen confidence, helping investors identify high-quality companies with sustainable performance.
- Based on these metrics, Tesla, Adobe, and Nvidia currently stand out as strong candidates.
To know the best stocks to buy now or at any time, you have to look at 5 things first. Check the PEG ratio (Price/Earnings-to-Growth), at least five-year ROE ratio (Return on Equity), Debt-to-Equity ratio, Three-year EPS (Earnings per share) growth, and the analyst ratings.
Understanding the Five Main Metrics to Identify the Best Stocks to Buy Now
Price/Earnings-to-Growth Ratio (P/E Ratio):
This ratio indicates the price investors are willing to pay for each dollar of a company’s earnings. The growth rate means the potential annual growth rate of the company’s earnings. It’s important to check this ratio to know whether the stock is overvalued or undervalued. P/E ratio takes into account both current earnings and future growth prospects.
Return-on-Equity Ratio (ROE Ratio):
It’s a key indicator of the company’s profitability in relation to the money invested by shareholders. ROE shows how efficiently the company manages its equity to generate income and returns. The ratio varies from industry to another, but a ratio above 15% often considered a good sign. The best practice for judging whether a company’s ROE is good is to compare it with its industry average.
Debt-to-Equity Ratio:
It compares a company’s total liabilities to its shareholders’ equity, showing how much the company relies on debt versus its own equity. A high ratio means that the company is using a lot of debt relative to equity. This can increase the risk but may also accelerate growth. A low ratio means the company has lower financial risk and is less dependent on borrowings. It has to be compared to the industry average.
Earning Per Share Ratio (EPS):
It’s a profitability metric showing how much profit the company generates for each outstanding share of its common stock. Higher EPS indicates that the company is performing well and is profitable. EPS is not a standalone metric. You have to combine it with other metrics to evaluate the company’s financial health.
The Analyst Ratings:
They are recommendations made by financial analysts, including major banks and accredited researchers, for a stock’s future growth and performance. Ratings typically are Buy, Hold, or Sell. The analyst rating is helpful, but keep in mind that it’s based on assumptions that can change and impact the analyst’s outlook. You can use it with other metrics to support your decision.
What Fundamental Levels Define the Best Stocks to Buy Now?
- When the PEG ratio is 1.5 or less,
- Return on Equity ratio of 20% or higher.
- Debt to equity below 1.
- EPS growth averaging 15% or more for three years.
- Positive analyst ratings.
If you find the stock’s ratios close to these levels, it may indicate a strong stock to buy now. Let’s address the main question of our article: what are the best stocks to buy now?.
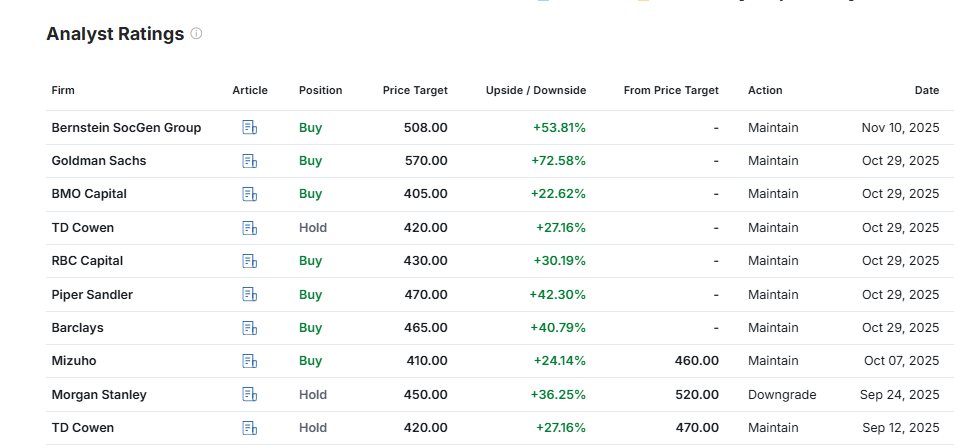
Nvidia (NVDA):
NVIDIA is one of the best stocks to buy now, according to its positive ratios.
- PEG Ratio: current ratio is 0.85% & 1.72% as of 31 July 2025, according to YahooFinance.
- ROE Ratio: 109.42% (ttm) Trailing Twelve Months.
- Debt to Equity: for the most recent quarter is 10.58%, below the industry average of 30.43%.
- EPS: 5-year EPS growth is 91.89% above the industry average, which is a good sign.
- The Analyst Ratings: positive with 59 recommendations for “BUY”, only 4 for “Hold”, and 1 for “Sell”
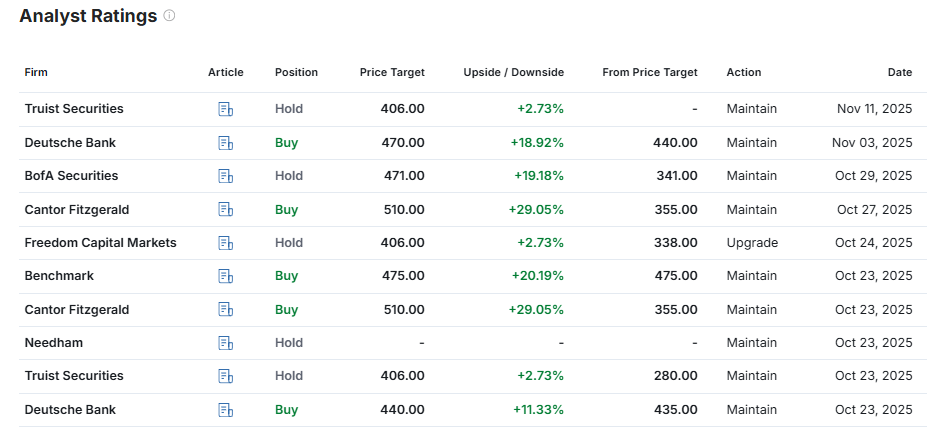
Adobe Inc. (ADBE):
Adobe is considered one of the best stocks to buy now because of its positive ratios.
- PEG Ratio: current ratio is 0.95%
- ROE Ratio: it’s 52.88% higher than 20% which is a good sign.
- Debt-to-Equity Ratio: It’s 56.54% above the industry average.
- EPS: 5 Year EPS growth is 15.55% below the industry average.
- The Analyst Ratings: Positive with 25 recommendations for “Buy”, 12 for “Hold”, and only 3 for “Sell”.
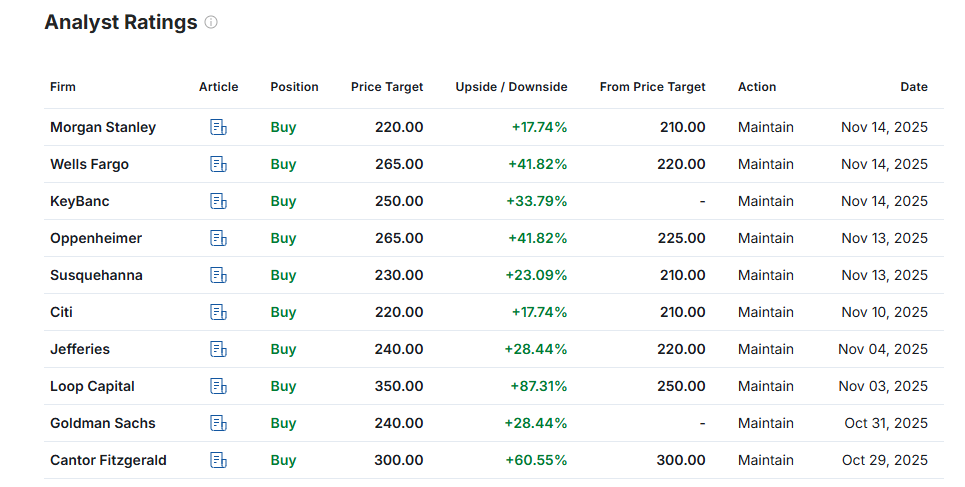
Tesla Inc. (TSLA):
- PEG Ratio: It’s 7.98% too close to the industry average, but still above it.
- ROE Ratio: The 5-year ratio is 19.22% above the industry average.
- Debt-to-Equity: it’s 17.08% below the industry average, which indicates that the company is less dependent on borrowings. Financial risk is low.
- EPS: 5-Year EPS growth is 44.22% above the industry average.
- The Analyst Ratings: Positive with 20 recommendations for “Buy”, 17 for “Hold”, and 10 for “Sell”.