
- Lloyds Bank share price has been on an upbeat momentum and is just 5% away from the psychologically important 100p. We asses the odds.
Lloyds Banking Group’s stock (LSE: LLOY) has been doing well lately, grabbing investors’ eyes with a share price jump in the past month. It’s up almost 15% in that period , and the stock is getting close to levels we haven’t seen in a while. The question is whether it can the momentum to the psychologically significant £1 mark before the year ends.
What’s Fueling Lloyds Bank Share Price Rally?
The bank’s rally is not a fluke but the result of a powerful convergence of fundamental and legal factors. The most immediate and significant boost came from a landmark UK Supreme Court ruling concerning motor finance commission claims.
This ruling cleared up a legal issue that had been dragging down the stock for a while, easing worries about what Lloyds might have to pay out. The resultant clarity on the firm’s financial liability instantly injected investor confidence and provided a powerful upward catalyst.
Plus, Lloyds’ financial results have been solid. Their third-quarter report showed a net income, released on October 23, revealed year-to-date net income of £13.6 billion, up 6% from the year prior. Meanwhile, quarterly income edged 3% higher quarter-on-quarter to £4.6 billion.
This reflects widening lending margins and resilient deposit growth, bolstered by higher interest rates that have padded profitability. Furthermore, share buybacks have amplified returns, with the program rolling on and contributing to the stock’s 40% year-to-date gain.

Will Lloyds Stock Reach £1 By Year’s End?
At this point, 100p looms tantalizingly close, just 5% above current levels. Third-party forecasts point to an average December close of 107.53p, with highs potentially reaching 120.57p if tailwinds hold. City experts have been raising their targets, with some seeing 100p as the next goal, something that hasn’t been reached since before the 2008 crisis. A rate cut in December could also help, by making borrowing cheaper and boosting lending.
Lloyds Bank Chart Technical Analysis
Lloyds Bank share price chart exudes bullish vigor, but momentum indicators whisper of caution. The Relative Strength Index (RSI) at 78.79 signals strong upward drive yet in overbought territory, hinting at a possible pullback if buying enthusiasm wanes. Key support rests at 92.26p, which aligns with the middle Bollinger Band. An extended control by the sellers could push the action lower to test 90.56p.
On the upside, primary resistance will likely be at 95.88p. If the buying momentum strengthens further, it could go above that barrier and test the upper Bollinger Band at 98.80. Beyond that point, it could clear the path to £1, aligning with psychological and historical highs.
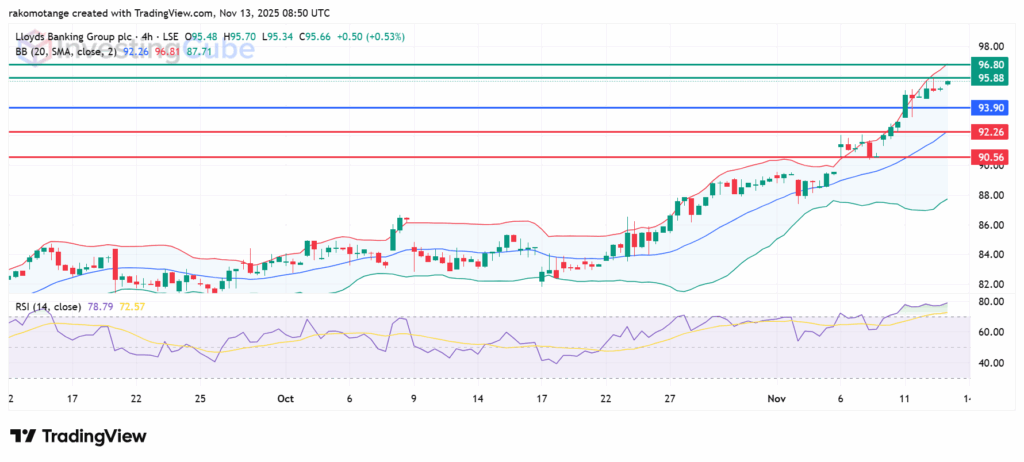
Lloyds Bank 4-hour Chart on November 13, 2025. Source: TradingView
A favourable UK Supreme Court ruling on motor finance commission claims reduced the feared legal risk and financial liability overhang that had been depressing the stock’s valuation. Also, the Bank reported upbeat earnings results which exceeded analysts’ forecasts and extended its share buyback program.
The consensus among analysts is cautiously optimistic, with a median 12-month price target hovering around 100p.
Lloyds share price momentum is upbeat and its only about 5% off the £1 mark. Sustained momentum and rate cuts could push it over that mark