- In this article, we look at IAG share price key performance metrics and assess its likely trajectory for the remainder of the third quarter.
International Consolidated Airlines Group (LON: IAG), the parent company of British Airways, Iberia, and other carriers, has extended its post-pandemic momentum and its key metrics signal likely continuation of growth. This week, IAG share price went up to 393.60p, the highest level since February 2020. In terms of growth, the stock has also gone up 30% year-to-date and 128% in the last year.
But it’s hardly an outlier when it comes to growth. In the past year, airline business has grown a lot since more people want to travel and fuel prices have gone down. But problems like unstable trade tariffs and rising geopolitical tensions are still there. In this article, we delve into IAG’s key fundamentals, momentum indicators and moving averages, and assess the likely price trajectory for the remainder of the third quarter.
IAG’s Key Fundamentals Signal Healthy Financial Standing
The fundamentals of IAG show that the company is taking advantage of strong demand while keeping costs down. Its Trailing Twelve Months (TTM) revenues are €33.28 billion, mostly because a jump in passenger numbers on its transatlantic and European routes. Its quarterly revenue rise YoY was 6.80%, thanks to more passengers in premium cabins and higher load factors.
In addition, net income for the TTM is €3.13 billion and it realised an impressive profit margin of 9.40%. The airline group registered an uptick in its earnings not only because it has a lot of passengers, but also because it keeps costs down by modernizing its fleet and hedging against changes in fuel prices.
The company’s most recent Earnings per Share (EPS) on a trailing basis is €0.56, and the price-to-earnings (P/E) ratio is 7.01. These figures indicate the stock is undervalued relative to peers like Lufthansa or Delta Air Lines, whose corresponding figures are at higher multiples. The forward P/E of 6.50 also shows that analysts expect earnings to keep growing. For the current quarter ending September 2025, analysts forecast that EPS will likely come at €0.29, while the revenue estimate is at €9.47 billion.
Balance Sheet Signals Improvement
IAG share price upside potential is also supported by strong balance sheet metrics which show that the company is in a leveraged but improving position. The airline group owes €14.81 billion, and its debt-to-equity ratio is 248.48%. This reflects the capital-intensive nature of aviation and also doubles as a warning that the management has no room for error.
That said, IAG has plenty of cash on hand with an operational cash flow of €5.58 billion and a levered free cash flow of €2.49 billion. Its return on equity (ROE), on the other hand, is an impressive 58.30%, which shows that it is using shareholder capital well.
Recent news adds support to the positive outlook for IAG share price performance. IAG also announced an interim dividend of €0.030 per share, which is a yield of 1.96%, in its half-year 2025 results posted on August 1. This shows that the company is confident in its growth potential.
What Are the Risks?
Even though IAG share price performance has been good, the company still has to overcome underlying risks including increased labor costs and possible economic slowdowns caused by trade tariffs. These could impair discretionary travel. However, its diverse portfolio, which includes both low-cost airlines like Vueling and high-end airlines like British Airways, could help lower the risks.
IAG Share Price Momentum Indicators and Moving Averages
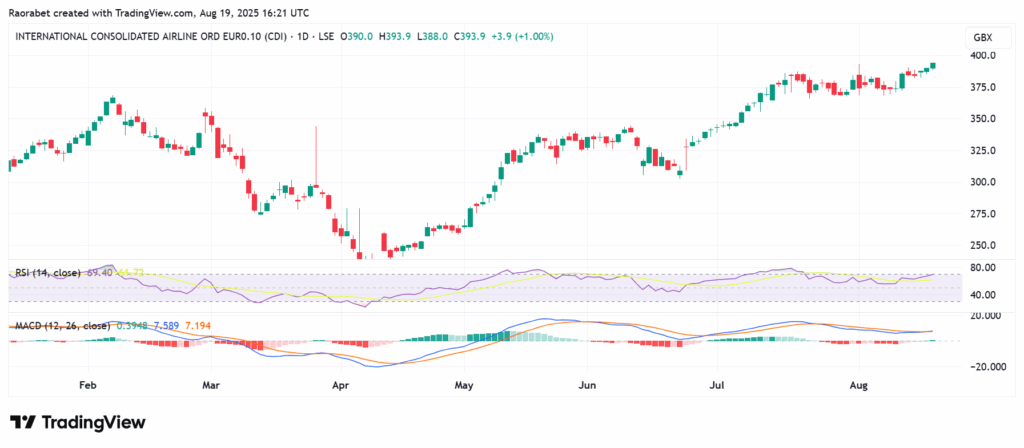
From a technical point of view, the momentum on IAG share prices signals a likely extended growth. The stock is currently at 393p, which is above its 50-day simple moving average (SMA) of 358p and its 200-day SMA of 310p. This shows that the trend is bullish. This “golden cross” setup usually means that there will likely be a lot of purchasing pressure in the near-term.
| Indicator | Value | Signal |
| 50-day SMA | 358.18 GBp | Buy |
| 200-day SMA | 310.32 GBp | Buy |
| RSI (14) | 67.15 | Neutral/Bullish |
| MACD | 7.37 | Buy |
Also, the stock’s momentum indicators back up this narrative. The Relative Strength Index (RSI) is at 69.40 right now, which is quite close to the overbought level. This suggests that recent high gains are likely to continue without any immediate danger of reversal. Also, the Moving Average Convergence Divergence (MACD) for IAG shares is positive at 7.58, and the signal line is below the MACD line at 7.19, which fits with the optimistic view.
Likely Price Trajectory for Q3 2025
As we look ahead to late August and September 2025, IAG’s price trajectory seems to be slowly rising, maybe target the 400p-420p bracket. This is likely due to seasonal factors and expectations of strong earnings in Q3. In August, late summer tourism peaks, which could help boost Q3 results. Analysts expect the September quarter to bring in €9.47 billion in revenue. If demand stays high, as shown by recent additions of transatlantic routes, IAG could establish the 400p mark as a support level.
On the other hand, leisure travel usually goes down in September when schools resume, and that could lead to consolidation. In general, the stock’s performance will be affected by the market sentiment in the broader market, such as the performance of the FTSE 100 and oil prices. Also, Brent crude has been stable and airlines’ hedging strategies will make it easier to shield margins.
IAG Share Price Risk Assessment
Despite the strong position, IAG share price momentum is exposed to risks including geopolitical pressures, macroeconomic headwinds and potential strikes related to industrial action. Nonetheless, IAG’s fundamentals and technical momentum favor resilience. Furthermore, fresh impetus will likely come in following release of the thirds quarter earnings results.