
- BT stock has been on a downward momentum in the last month, dropping nearly 3% in that period. We tell you why and weigh chances of a reversal
BT Group’s shares have been sliding lately, dropping more than 2% over the past month and a whopping 15% in the last two, leaving investors wondering if the UK’s telecom giant is stumbling into a deeper rut. The decline is less about a single catastrophe and more about a cocktail of persistent corporate headwinds that spook institutional investors.
Why Is BT Stock Declining?
The downturn really started in early October, when analysts cut their ratings on the stock twice. Exane BNP Paribas gave the company a “Underperform” rating and set a bleak price target of 150p. They said this was because of increased uncertainty in the sector and the fact that competitors would be able to acquire deals through mergers instead of organic development.
On top of that, there was BT’s revenue problem. The company cut its guidance for fiscal 2025 by 1–2% in November 2024 because sales of low-margin products overseas were falling and the business unit forecast was weaker. Then there’s the bigger squeeze. Higher capital costs for 5G rollouts and fiber goals are cutting into profitability, even if core EBITDA rose 1% thanks to cost-cutting and pricing increases on older services.
On top of this, the company’s enormous net debt (approximately £20 billion) and large pension commitments make things even more difficult. This balancing act with money caused UBS to lower the stock’s recommendation to “sell” lately. The bank explicitly said that the market might not be taking into account how rising interest rates will affect free cash flow.
Will BT Stock Bounce Back?
Is there a way out of this? Many investors think so. However, the bull case depends entirely on how well the Openreach initiative goes. Management has said that the expensive full-fiber project has already reached its highest point of capital spending. That suggests that cash flow should become positive and grow a lot in the next few years.
For the stock to really turn around, it needs to show that it can beat the competition with its cost savings and full-fiber uptake. If it does that, it could achieve the projected growth in free cash flow.
BT Stock Price Prediction
BT stock price chart screams caution but also hints at stability. The stock is clutching a crucial support level at 180p, which is a key psychological support for the last 20 days. It tested this level during October’s volatility.

If it breaks below this level, it might go as low as 176p, which is below the 200-day SMA. Initial resistance is at 183p, but a stronger momentum will clear that barrier and potentially test 187p. RSI is at 33, which means it is getting oversold. This means that sellers are tired and the market could turn around if RSI goes above 50.
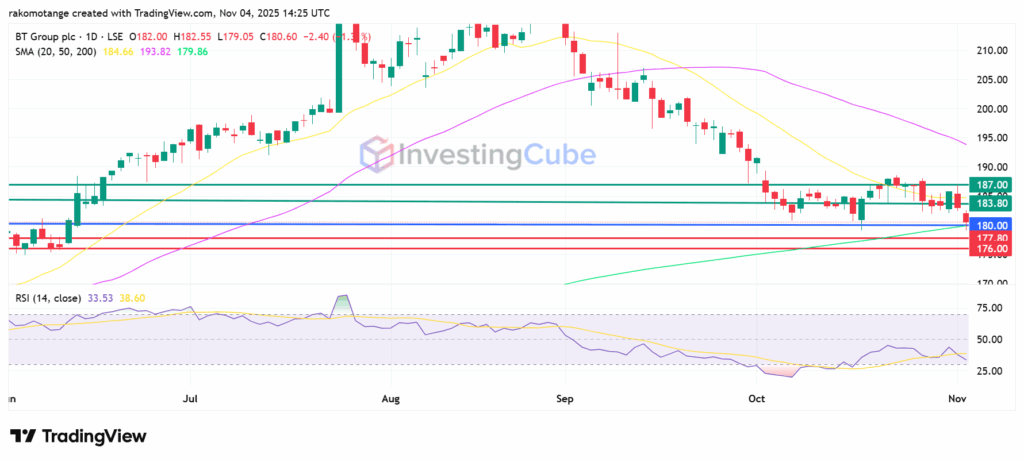
BT stock price on November 4, 2025. Source: TradingView
BT stock is declining because of missed revenue expectations, the high cost of its full-fibre rollout, a substantial net debt of about £20bn, and ongoing pension obligations. These factors have led to a recent ‘sell’ rating downgrade from UBS.
Recovery by BT will depend on the uptake of its Openreach full-fibre project. The management expects capital expenditure to peak soon, leading to a significant “inflection” in free cash flow (FCF) growth.
Immediate resistance levels will likely be around 183.80p and 187p. If the stock decisively holds above these levels, it could signal a potential reversal in its downward momentum.