The Nasdaq 100 index has given up the earlier gains of the session. It now trades 0.87% lower, continuing the negative response to yesterday’s 75 basis points rate hike by the US Federal Reserve. Tech stocks are leading the slide on the day.
A component of yesterday’s hawkish actions was the FOMC “dot-plot,” in which the Fed Chair
Jerome Powell defined the pathway for further rate hikes and essentially set new targets for inflation and the Fed’s rate hike responses.
The dot plot calls for interest rates above 4% by the end of the year, leaving room for further rate hikes in the November and December meetings. Rates are expected to top out at between 4.5% and 5% in 2023. This is a more hawkish projection than the June 2022 dot plot which had seen rates top out at 3.25% at the end of 2022. The Core PCE Price Index is also seen at 5.4% in 2022, up from the June estimate of 5.2%.
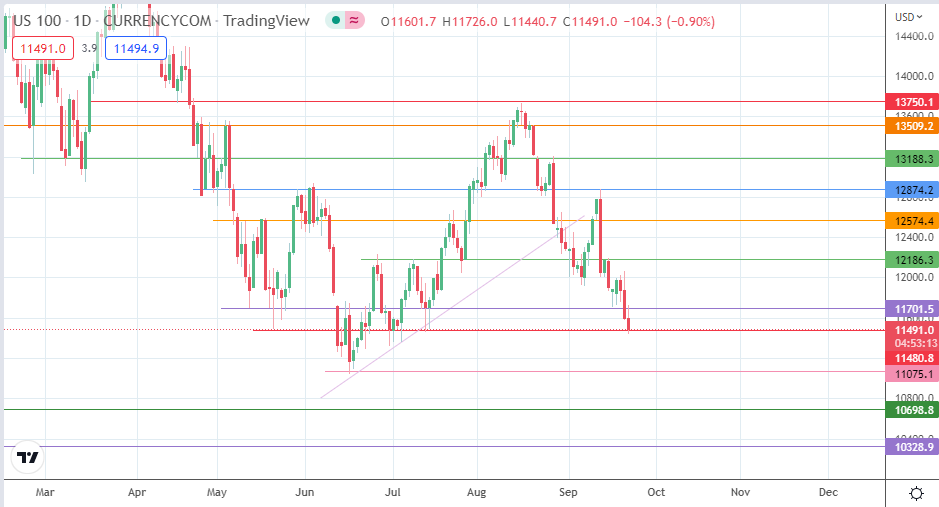
From the technical analysis standpoint, the failure to transcend the support-turned-resistance at 11701 has favored the push to the south. The pivot at 11480 is now vulnerable as a consequence. The ability of the bulls to defend this support will determine if the Nasdaq 100 continues towards three-month lows or not.
Nasdaq 100 Index Forecast
The Nasdaq 100 index is testing support at the 11480 price mark. This follows the rejection of the upside move at the 11701 resistance. A breakdown of this support clears the route for the bears to push toward the 11075 support (16 June 2022 low).
Failure to defend this pivot sends the Nasdaq 100 toward the 10698 support (24 September 2020 low). The 24 July 2020 low at 10328 rounds off the potential harvest points to the south. On the flip side, the break of 11701 gives the bulls clear skies to aim for the 12000 psychological price mark initially (15 July and 19 September 2022 highs).
If the bulls uncap this barrier, the 12186 resistance formed by the 8 July/14 September highs constitutes the next upside barrier. 12574 (11 May high) and 12874 (30 May and 13 September highs) form additional northbound targets.
Nasdaq 100: Daily Chart