The US dollar index (DXY) weakness is continuing in the new month. The index is down by 0.30% and is trading at $91.86, which is the lowest it has been since April 2018. This is also the fifth straight month that the index has been in the red.
The dollar index is down because the greenback is down against all currencies in the index. It has fallen by 0.50% against the Swedish krona, 0.37% against the Swiss franc, 0.30% against the Canadian dollar, 0.40% against the euro, and 0.30% against the sterling. The dollar has also fallen against emerging market currencies like the South African rand and the Turkish lira.
There are three primary reasons why the US dollar index is under pressure. First, the US dollar is falling because of the dovish statement that Jerome Powell issued on Thursday at the Jackson Hole summit. In the statement, he reiterated that the Fed would let interest rates remain at the current levels for a longer period in the bid to lower unemployment rate. This simply means that the rates could remain this low for the next five years.
Second, the dollar index is falling because of the upcoming general election in the US. Recent polls show that the race between Donald Trump and Joe Biden was narrowing. Therefore, the election is creating uncertainty about the future of the US.
Third, the dollar index is falling because of the rising number of coronavirus cases in the US. The country has confirmed more than 6.2 million cases and more than 187K deaths. And with the ongoing protests, there is a possibility that the number of cases will continue to rise.
Today, the index will react to PMI data from Asia, Europe, and the US. The data released today showed that manufacturing PMI in China rose to 53.1 in September. Another data showed that the PMI in Japan made a slight improvement while that in Australia dropped.
US dollar index technical outlook
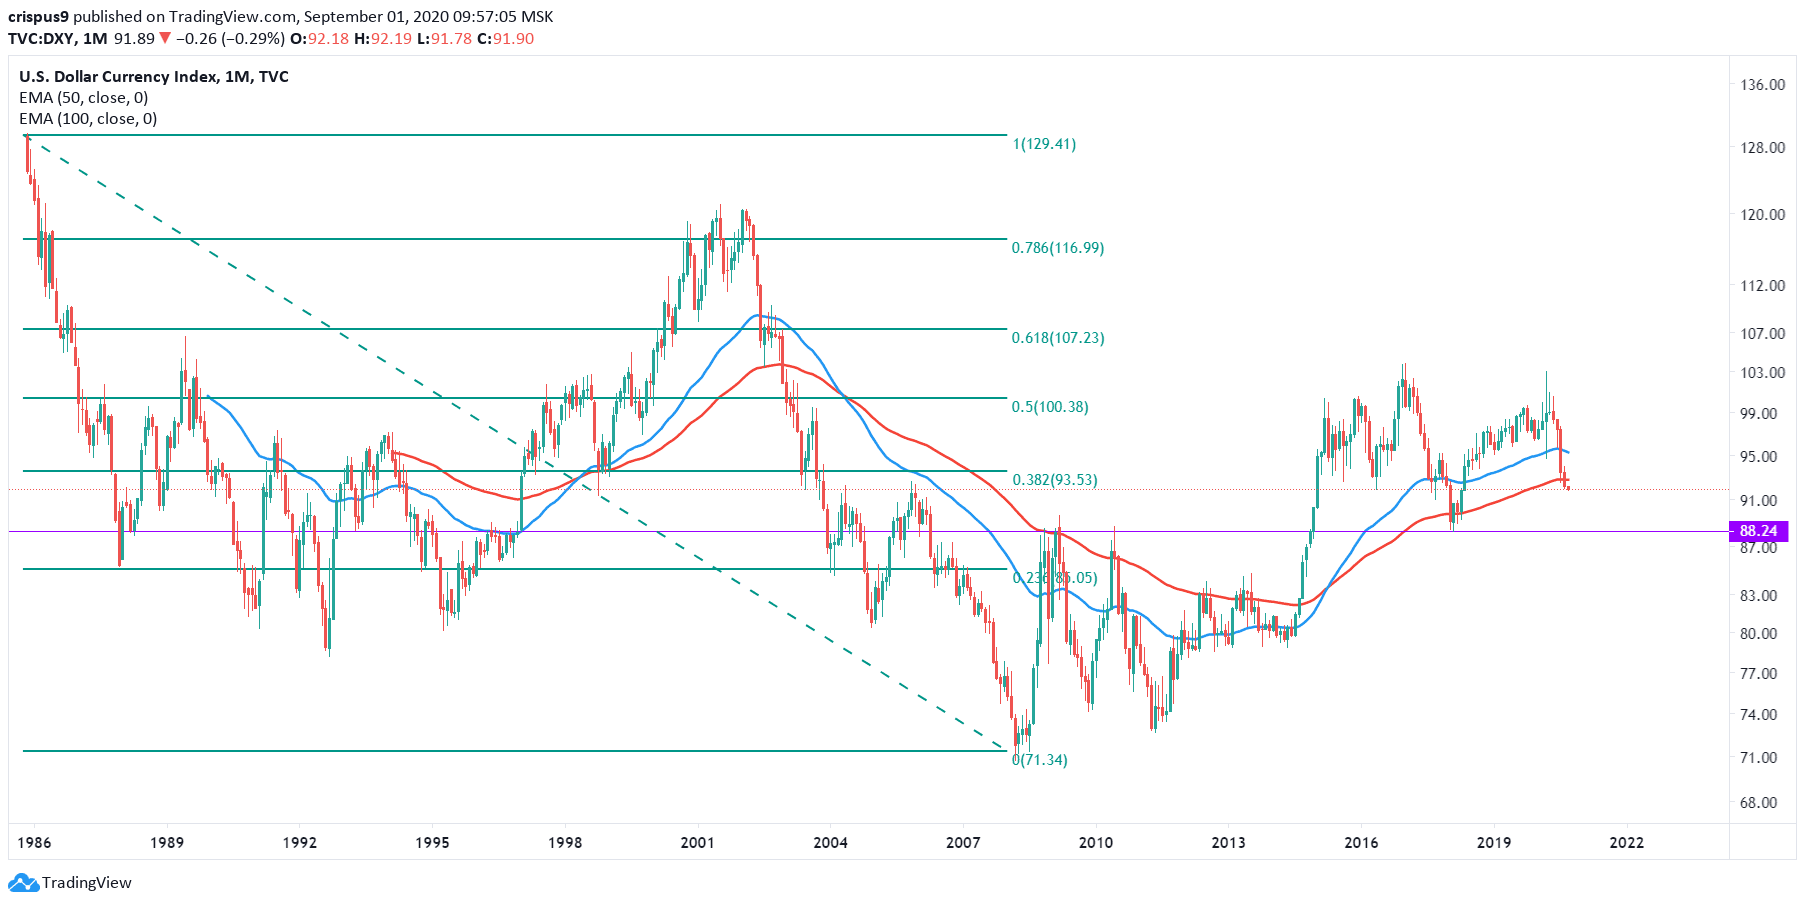
The monthly chart below shows that the US dollar index has been in a downward trend since March, when it peaked at 103.12. Since then, the index has been in a downward trend and is now below the 38.2% Fibonacci retracement level. This retracement connects the highest point in 1988 with the lowest level in 2008. Also, the price has just moved below the 50-day and 100-day exponential moving averages.
Another thing is that the dollar index has formed a head and shoulder pattern. Therefore, there is a possibility that it will continue falling as bears target the support at 88.24. This level is the neckline of the head and shoulders pattern. On the flip side, a move above this year’s high of 103.12 will invalidate this trend.
Don’t miss a beat! Follow us on Telegram and Twitter.
US dollar index technical chart
More content
- Download our latest quarterly market outlook for our longer-term trade ideas.
- Follow Crispus on Twitter.
- Do you enjoy reading our updates? Become a member today and access all restricted content. It is free to join.