
- The Dow Jones Index hit all-time highs of 48,886 points a week ago
- Mixed signals from the US economy has investors at a crossroads on the Fed's likely next move
- Concerns over potential overheating of the tech sector remain
After hitting a high of 48,886 points on December 12, 2025, the Dow Jones Industrial Average (DJIA) has cooled off. The index had a tough four-session losing streak before the year ends, which made some investors nervous. This article looks at what caused the market to become unstable and if it will bounce back before the end of the year.
Shifting Market Fundamentals
The rise to record highs was first due to optimism about stable interest rates and the economy doing well. But, the recent drop shows that investors are being more careful.
The main reason for the fall in December wasn’t a sudden economic crisis, but a reality check in the artificial intelligence (AI) industry. Big companies like Oracle and Broadcom announced investment plans that worried investors, which led to a shift away from growth stocks. Even the Dow, which doesn’t have as many tech stocks, was affected.
The recent US economic data was mixed. While the jobs numbers for November were better than expected, there were still worries about consumer spending and global demand. The Federal Reserve’s decision to keep interest rates the same while inflation cooled added to the uncertainty. According to Saxo Bank’s Market Quick Take on December 19, the PCE inflation reading for December was lower than expected at 2.7%.
This lower inflation number eased some concerns about rate hikes but pointed to potential economic slowdowns. In addition, U.S. policy changes on tariffs and slow growth in China put pressure on oil and commodities, which indirectly hurt industrial companies, according to Reuters.

Will It Rebound Before Year-End?
There’s a good chance that the market will rebound to around 48,000 before December 31. The lower inflation data on December 19 caused some buying, but, there are still risks if the economic data gets worse or if worries about AI increase. In general, strong earnings and lower inflation create a base for recovery, which could happen in the final trading days if there’s enough trading activity.
Dow Jones Index Forecast
The Dow Jones Industrial Average Index RSI is at 54, which signals an underlying bullishness. The first resistance will likely be at 48,370 points, with a stronger momentum potentially pushing gains to test 48,725. The first defense line is at 47,600, below which the upside narrative will be invalid. A stronger hold by the sellers could send the index to test the 100-day EMA at 47,204.
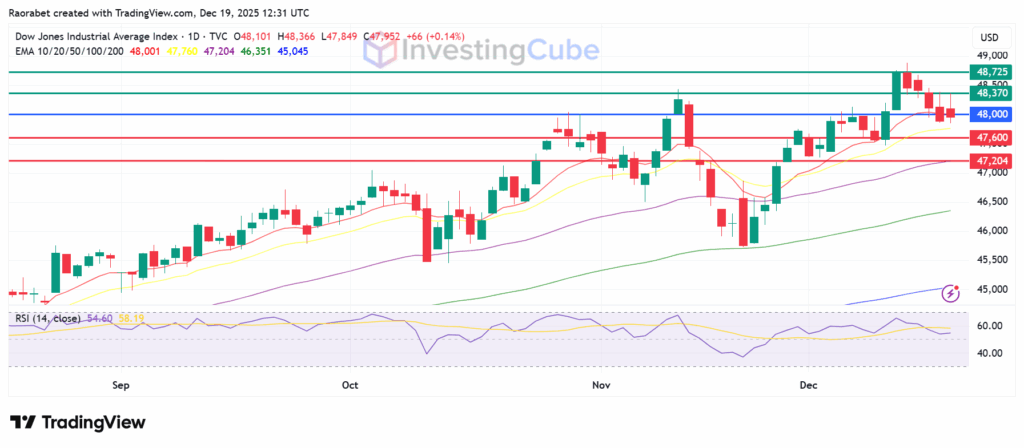
Dow Jones Index daily chart with key support and resistance levels. Created on TradingView
The November CPI was 2.7%, which is lower than analyst forecasts. On December 18, this news stopped a four-day slide because it hints the Federal Reserve might keep cutting rates.
Keep a close watch on the 47,600 support level. If the Dow stays above that and then jumps past the 48,370 resistance level, it could mean the market is headed up again.
Not exactly. Some people are worried about high prices and the market being shaky at the end of the year. Still, good earnings reports and steady rates are making others feel hopeful.