The Hedera Hashgraph price prediction appears headed for the bearish end of the spectrum after the token slumped 6.82% on the day. This move continues the evolution of the bearish pennant on the daily chart, with the price candles now testing support at the 0.0948 price level.
Since facing rejection at the 0.2680 price resistance on 29 March 2022, it has been all downhill for the HBAR token. The overwhelming market sentiment has overtaken the pair. So strong has been the sentiment that some tokens have lost as much as 90% of their all-time high values.
On days when the bulls were in control, the momentum generated to the upside was muted, and trading was characterized by low volumes, indicating the extent of the bearish bias. With virtually no bullish fundamental triggers on the horizon, the HBAR/USD pair has been left to the vagaries of a bearish market where the bears are driving prices to all-time lows.
The technical expectation of the pattern is a bearish continuation of the prevailing downtrend. This will be accentuated if the bears succeed in breaking down the immediate support at 0.0948.
Hedera Hashgraph Price Prediction
The evolving bearish pennant on the daily chart points to a further decline, with 0.0301 (22 December 2020 low) serving as a potential point for completing the measured move. To attain completion, the bears must drive this move hard to degrade the support level at 0.0646 (18 January high).
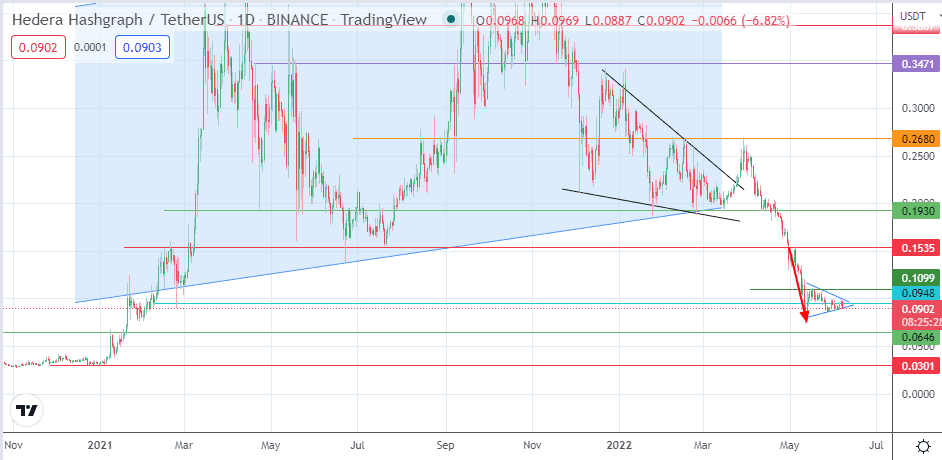
On the flip side, a bounce on the 0.0948 support (8 February 2021 high) allows for a push toward the 16 May high at 0.1099. Above this level, additional targets to the north reside at 0.1535 (19 February and 5 May highs) and 0.1930 (15 March and 14 April lows). It is also possible for the bears to capitalize on any rallies to initiate short positions in the context of the downtrend.
HBAR/USD: Daily Chart