Gold (XAU/USD) price continues to hold the key support level of $1,980 ahead of the FOMC meeting in the United States. In the crucial meeting, the US central bank will decide on the interest rates in the world’s largest economy.
At press time, Gold price per ounce stood at $1982.59 after a 0.17% increase during its New York session. However, Silver price dropped for eight consecutive days and was down 0.62% till press time. This price action in the precious metal comes after a minor recovery in the dollar strength index in the past few days.
The November 2023 CPI data showed that the inflation is still falling in the USA. However, the markets are still awaiting the FOMC decision to see how the Federal Reserve reacts to the latest recent economic data.
As per the CME Fed Watch Tool, there’s only a 1.8% probability of a rate hike in the December FOMC meeting which means that the rates will likely remain constant at $5.25-5.50. While the FOMC decision is pretty much a given, it will be the tone of the Fed Chair and FOMC members that will impact Gold prices.
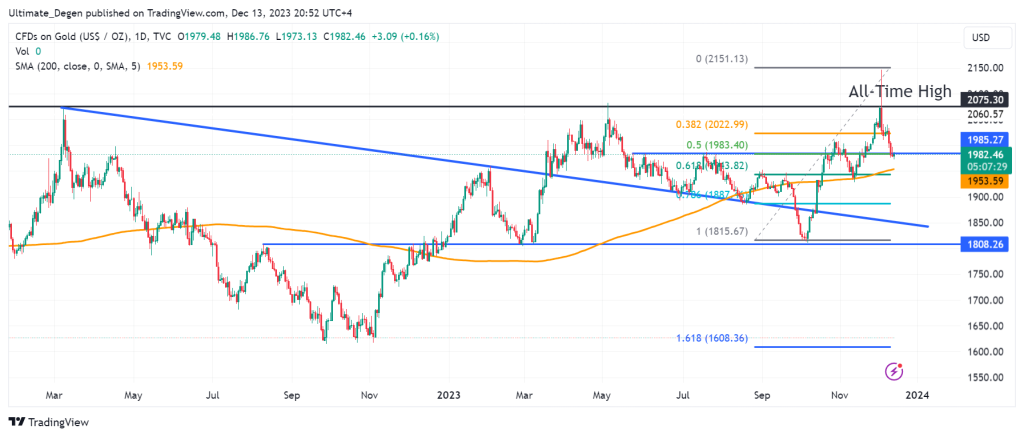
After a momentary surge to its highest level in history, XAU/USD failed to close above its previous all-time high of $2,081. As a result, the precious metal has seen an 8% correction from the monthly highs and the control is shifting toward the bears.
Consequently, the Gold price forecast now depends on the price action around the $1,980 level which has acted as a pivot on multiple occasions. So far, this level is acting as a support but the release of the FOMC statement will likely increase the volatility in the metals.
In case of a breakdown below this level, the price may find support around $1,943 level which is a previous support and also the 0.619 fib retracement level. The 200 MA also lies very close to this level at $1,953 on the daily chart as shown in the chart below.