The FTSE 100 index staged a strong recovery, making it one of the best-performing indices in Europe. It rose to a high of £7,506, which was the highest point since August 22. The index has surged by over 12% from the lowest level in October as most constituent companies rebounded.
UK stocks recovery gains steam
The FTSE 100 index has been in a strong bullish trend in the past few weeks. In this period, the index has outperformed its European counterparts like the FTSE MIB, CAC 40, and the German DAX index.
Most companies in the FTSE index have rallied despite the relatively weak economic data from the UK. Numbers showed that the country’s inflation jumped to 11.1% in October while retail sales have plunged in the past few weeks. Further, the housing market has come under intense pressure as interest rates have surged.
The FTSE 100 index has risen as investors cheer the stability brought by Rishi Sunak’s new government. In his autumn statement, the chancellor reiterated that the country will continue hiking taxes in a bid to put its finances in order.
Most FTSE 100 share prices have been in a strong bullish trend in the past month. Ocado has been the best-performer, having risen by 35% in this period. The shares rose after Ocado inked a deal with South Korea’s Lotte Shopping. Centrica share price has jumped by 30% in the past 30 days. Other top companies like Fresnillo, Anglo American, and Rio Tinto have soared by over 20%. Firms like Burberry, IAG, and Sainsbury have also rallied,
On the other hand, the only laggards are companies like DCC, Vodafone, Persimmon, Shell, BT, and British American Tobacco.
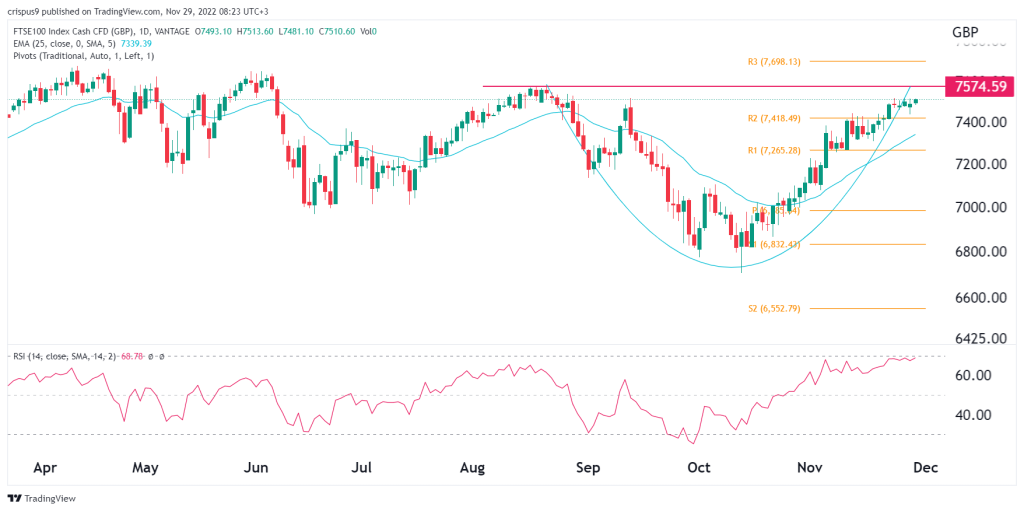
FTSE 100 forecast
The daily chart shows that the Footsie index has been in a strong bullish trend in the past few days. In this period, the stock has surged above the second resistance of the standard pivot point. It has also moved above all moving averages while the Relative Strength Index (RSI) has moved close to the overbought level.
The FTSE 100 index has formed what looks like a cup and handle (C&H) pattern. In price action analysis, this pattern is usually a bullish sign. Therefore, the stock will likely continue rising as buyers target the key resistance at £7,700, which is the third resistance. A drop below the support at £7,450 will invalidate the bullish view.