- Protracted trade negotiations between the United States and India have complicated the rupee's recovery, with high Foreign Institutional Investor outflows hitting $16.5 billion.
- The rupee still has to grapple with familiar struggles in the form of a high oil import bill, which raises the demand for the dollar, adding propulsion to USD/INR.
- Potential moved by the Fed to delay interest rates also favours the greenback.
After weeks of trading in a narrow band around 87.50-88.75, the USD/INR pair surged to a fresh all-time high of 89.68 today, hitting a new all-time high. Furthermore, it recorded the biggest single-day gain of the year, and was up by 1.01% on the daily chart at the time of writing. This rise is a clear break from the previous trend, but what caused it, and where might it go through December?
The Catalysts Behind USD/INR’s Sudden Surge
A number of variables, both global and domestic, worked together to push the USD/INR to recent highs. New U.S. trade taxes from late September 2025 are a big factor. These taxes have made imports more expensive and slowed growth.
High oil prices, hovering near $85 per barrel, further strain India’s $200 billion annual import bill, as noted in Economic Times coverage from October 15, 2025. Meanwhile, the Reserve Bank of India (RBI) has adopted a hands-off approach, reducing interventions and allowing more volatility to foster two-way market dynamics, per Traders Union forecasts.
What’s Shaping USD/INR Trajectory?
The USD/INR pair’s movement depends on some key economic factors. One is the difference in interest rates. The U.S. Federal Reserve has paused rate cuts, keeping rates at 4.75-5.00%. In contrast, the RBI cut rates by 25 basis points to 6.25% in October. This difference of over 135 basis points makes the dollar more attractive for carry trades.
Meanwhile, India remains heavily reliant on crude oil imports, which are dollar-denominated. Rising global oil prices increase India’s import bill, requiring more USD and thus weakening the rupee.
Also, the feelings of Foreign Institutional Investors (FIIs) are quite important.When people throughout the world are less willing to take risks, FIIs tend to take money out of emerging markets and put it into “safe haven” assets. This makes the INR weaker since they sell it for USD. However, political stability and corporate earnings in India could offer long-term support.
Will USD/INR Stay On the Uptrend Through Year-End?
Looking ahead, the immediate outlook suggests the USD/INR will likely remain biased to the upside for the rest of the year, driven by the strong momentum from the recent breakout. The recent high is now the new floor, and the market will probably stay around these new higher levels. NAGA analysts say that the range will be 88 to 90 because substantial FII outflows are still happening. According to a Reuters report on Friday, foreign outflows from Indian equities have reached $16.5 billion this year. In addition, India and the United States are yet to strike a trade deal, keeping investors on the edge.
According to CME FedWatch, there is a 50% chance that the Fed will lower rates in December, which could stop the dollar from rising. Another risk is that Indian GDP prints could be greater than expected.
Downside buffers include the RBI’s $650 billion in foreign exchange reserves, which can be used to intervene, and the price of oil falling below $80, which might reduce some of the pressure. Overall, expect volatility, but the path of least resistance points higher for USD/INR unless global liquidity surges.
USD/INR Forecast
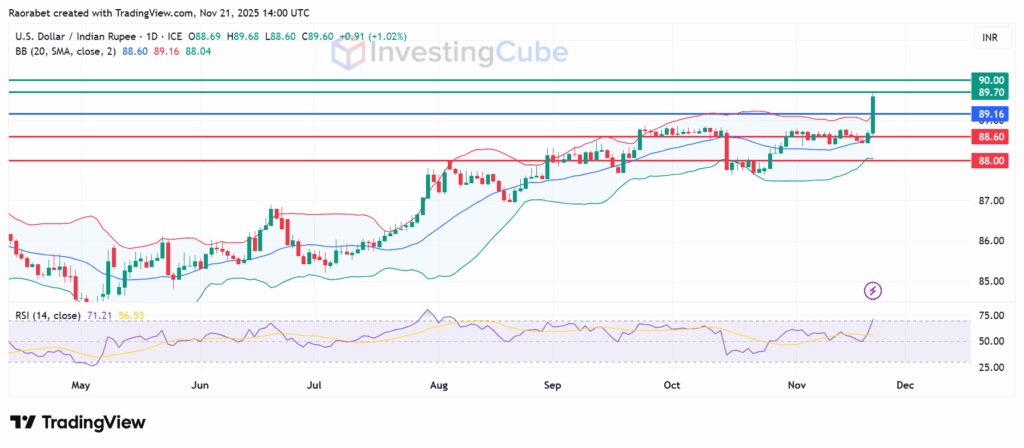
The USD/INR daily chart shows that the pair is in an upward trend, trading above the upper Bollinger Band. The middle band level at 89.16 serves as the pivot, with immediate resistance at 89.70. If the pair manages to flip that level into support, the bulls will target the psychological 90.00.
On the downside, primary support will likely be at 88.60 near the median mark of the previous range. With the RSI at 71 signaling overbought and affirmed by the break above the upper Bollinger Band, a stronger USDINR selloff could send the action lower to test the psychological 88.00.
When U.S. interest rates go up, dollar investments look better because they offer higher returns. This often leads to money flowing out of India and into the U.S., which pushes up the demand for dollars and weakens the rupee.
Because India imports large volumes of crude oil and needs U.S. dollars to do so, a rise in oil prices increases the demand for dollars. This constant need for dollars tends to keep pressure on the USD/INR exchange rate, causing it to drop.
The Reserve Bank of India’s policies, along with how importers and exporters balanced their risks, kept the exchange rate steady. But this changed when tariff issues and foreign investment outflows became too strong to manage.