

- USD/INR remains under pressure due to easing US inflation, a steady Fed outlook, and RBI intervention, while technically a bounce from the lower Bollinger Band and oversold RSI points to a short-term correction.
The USD/INR reached the expected levels outlined in our analysis last week. With the Reserve Bank of India’s intervention, the currency pair is exposed to losses near 90.00. The RBI intervention was in the spot and non-deliverable forward market. The aim is to support the indian rupee against the US Dollar.
The USD/INR advances by 0.04% by the start of the trading week. Traders remain cautious amid RBI intervention and no updates on the US-India deal. This article explores the technical outlook for the USD/INR, along with key fundamentals that may catalyze the USD/INR to find direction.
The Technical Outlook for the USD/INR:
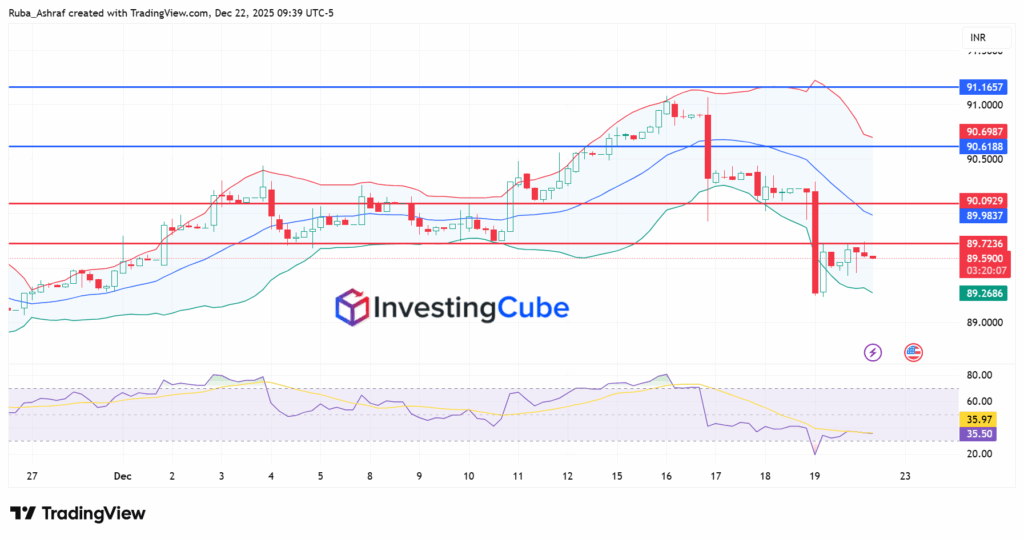
The USD/INR is currently trading around 89.50, the expected level that was outlined in last week’s analysis. The trading chart shows that USD/INR shifts from an uptrend into a sharp corrective phase.
The currency pair failed to sustain gains above the resistance zone near 91.15. The strength of such resistance level drops the USD/INR below the middle Bollinger band. This breakdown indicated a weakening of the bullish momentum, with the price sliding toward the lower Bollinger band.
USD/INR tested the lower Bollinger Band near 89.26. This happened before rebounding toward the 89.50 level. The rebound reflects that 89.26 is a strong support level. A clear daily close below 89.26 could pave the way for a move towards 89.12.

On the upside, a clear daily close above 89.98 could pave the way toward 90.09 and then 90.61. However, the RSI reinforces the bearish outlook. The RBI intervention fundamentally drives the bearish outlook. The RSI is hovering in the mid-30s, reflecting strong downside momentum.
As long as RSI stays below the 50 level and price remains capped beneath the middle Bollinger Band. The SD/INR is likely to remain capped beneath the middle Bollinger Band.
Key Fundamental Takeaways Influencing the USD/INR:
- The US Dollar hit a three-week low near 89.50, despite the greenback holding steady against major currencies. The remains USD/INR under pressure.
- All eyes are on the expectations of the Federal Reserve interest rate. Most market participants are expecting that the Fed will keep interest rates unchanged.
- According to the FedWatch probabilities, only a 22.5% chance of a 25 basis point rate cut in January.
- The US Consumer Price Index showed easing inflation. CPI slowing to 2.7% YoY and core CPI easing to 2.6% in November.
- Despite softer inflation, the Fed may not be dovish, as data was distorted due to the government shutdown.
- Cleveland Fed President Beth Hammack signaled no urgency to cut rates, suggesting policy may remain restrictive until at least spring.
- The upcoming catalyst for the US Dollar is the release of preliminary Q3 US GDP data on Thursday.
Short term rends are often gauged using technical indicators, chart patterns, and order flow analysis.
USD/INR is influenced by interest rate differentials, inflation, trade balance, and foreign investment flows.