

- The Rupee hit an all-time low near 92 per US Dollar on January 23, 2026, marking a significant decline from the 85-level seen a year prior.
- Daily chart analysis shows a well-defined bullish ascending channel with current price action consolidating near 91.56 after a failed attempt to break the 91.92 resistance.
- The RBI maintains an accommodative stance with a repo rate of 5.25%, while the US Fed remains divided, holding a higher range of 3.5% - 3.75%.
The Indian Rupee (INR) is at a historical juncture as of the end of January 2026. The resilient domestic economic outlook of India — now, to be sure, the currency has been under siege as monumental influences drive it clear through the psychological and historical level of 92 on January 23, 2026 —but India’s destiny shaking within is still foraging ahead. Here is the complete look at the factors driving USD/INR, the “Goldilocks” state of the Indian economy and the price outlook for the rest of this year.
Monetary Policy Divergence: RBI vs The Federal Reserve
The USD/INR pair remains heavily driven by the contracting interest rate differentials between the Indian central bank (RBI) and US Federal Reserve.
The RBI’s Pro-Growth Easing
The RBI, in December 2025, cut its policy repo rate by only 25 bps to 5.25%, the level last seen in July 2022. It represented 125 basis points reduction throughout the year, driven by confidence in a moderating inflation outlook, and that growth must remain high. In addition to the cut, the RBI also infused substantial system liquidity through OMO ($1 trillion) and forex swaps ($5 billion), seeking to ensure policy transmission. The RBI has revised its GDP forecast for FY2025-26 on the higher side to 7.3%, indicating a strong back to the domestic economy.
The Fed’s Divided Path
Meanwhile, on the other side of the Pacific in December 2025, the Federal Reserve lowered interest rates to a wide range between 3.5% and 3.75%. Yet the vote was hardly anonymous, with three dissents — rare for the committee. Even though some officials are pressing for deeper cuts in support of cooling labor market, others are worried about “stubborn” core inflation. Also, the expiration of chair Jerome Powell’s term in May 2026 adds a significant amount of leadership uncertainty, which could result in choppy messaging in the latter part of 2026.
India’s Macroeconomic Resilience: The Goldilocks Moment
And yet, from now at least, despite the weakness of the rupee on the external front, there is what economists called a “Goldilocks moment”. India has a combination of high growth and low inflation.
GDP Growth: Real GDP expanded by 8.2% in Q2 FY2025-26, on account of stronger growth of 9.1% in manufacturing and 9.2% in services.
Inflation Soothing: The consumer price index (CPI) inflation fell to a multi year low of 0.71% in November 2025, far below the RBI of 4%. It is the disinflation that has been caused by an extended correction in food prices and tax rationalization.
Statistical Reset: In February 2026, the government will launch a new data presentation in the form of re-based National Accounts and CPI data (with base years to be updated to 2022 to 2023 for GDP and 2024 for CPI). This measure, which would also include the application of “double deflation” is intended to give a more accurate and credible account of India’s economic health to global investors
International Triggers: Trade Deals and Tariffs
Trade flows at the present juncture remains the most potent qualitative triggers for the rupee.
The India-EU FTA
The India – EU Free Trade Agreement on January 27, 2026 — one of the longest pending negotiations in Indian trade policy — is expected to be resolved with the announcement of the “Mother of All Deals”. This agreement is likely to, by and large, increase India’s surplus with the EU by more than $50 billion by FY31, and expand exports into high-value sectors such as electronic and chemicals.
The India-US Tension
The U.S is a more volatile case. In Davos, President Trump describes Prime Minister Modi as “a friend of mine” and said he believes they can have a good deal, but there are reports that Vice President JD Vance and adviser Peter Navarro have in the past opposed trade deals with India. With U.S. tariffs exuding all-time highs of 50% on a few Indian items, the pending BTA — or the Bilateral Trade Agreement — is now the single most important “silver bullet” for stabilizing the rupee.

Commodities Market: The Crude Oil Tailwind
India is the world’s third largest oil consumer, importing about 85% of its crude, and therefore the rupee is very sensitive to fluctuations in energy prices. This is increasingly a cause for optimism in early 2026.
Price Collapse Outlook: SBI Research and the U.S. EIA forecast oil to average $55 in Q1 2026, and may touch $50 by June.
Impact on INR: A 14% adjustment in the Indian crude basket is estimated to drive an appreciation of 3% in the rupee, which could send it back towards 87.5 levels from current lows around 92.
Trade: The trade deficit expanded to $25 billion in December 2025 on account of gold prices, and although the oil price is lower, it will dampen the widening of this deficit over 2026.
Capital Flows and Technical Forecast
The capital account has been the main cause of stress for the rupee. FPIs withdrew $3.96 billion from Indian stocks in the first 16 sessions of January 2026. That is after a record $18.9 billion outflow in 2025. The FMCG ($679 million) and BFSI ($354 million) sectors have seen large selling contributing to the rupee’s fall.
Technical Outlook
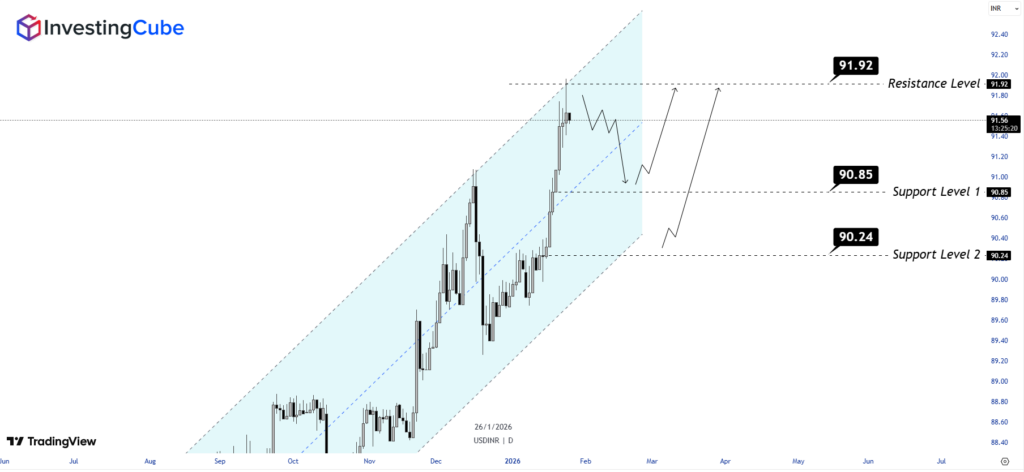
As can be noticed from the daily USD/INR price chart, the pair is trading on the bullish trend within an ascending channel. It is this technical picture that has formed the backdrop to a long-term weakening of rupee against dollar.
Key Technical Levels
- Resistance Level (91.92): This is the major overhead resistance of now. The price recently tested it and fell back, which indicates huge selling around a 92 level.
- Support Level 1 (90.85): The immediate bearish objective and support area. This is also the level at which consolidation phases have been initiated in previous occasions, and thus with the first support for bull on rupee.
- Support Level 2: It is an important horizontal support which comes at a lower end of the ascending channel. A breakthrough of this line will be the signal for a reversal of trend.
USD/INR Price Forecast
The chart shows the “zig-zag” movement between channels. The present rate is 91.56. It seems the pair is entering a short-term consolidation phase. The ideal expectation is a correction into support level 1 (90.85) after this correction. Technicals may indicate a new test of 91.92 resistance. A break higher looks for a move into the 93.50 or 94.00 area by late Q1 2026 above 91.92. On the other hand, if we reach and bounce from support level 2 (90.24), then the pair is likely to range within the channel structure.
Frequently Asked Questions
The depreciation is mostly “imported” with capital flows. Interest rate differentials between RBI (5.25%) and US Fed (3.75%) narrowing along with uncertainty and tariffs in the US has weighed on the currency, despite healthy domestic growth and huge FPI outflows ($3.96 billion in January).
India buys 85% of its crude oil. A fall to $50 would go a long way towards closing the trade deficit. This technically significant break could however give the USD/INR all of the momentum it needs to breakdown past 90.24 on a sustained basis, which will see the exchange rates exit from its bullish channel
investors should observe the 91.92 resistance level and 90.85 support point. A failure to close above 91.92 should prompt reversion towards 90.85, but anything surpassing it may establish new all-time highs in excess of 93.00.