
- GBP/USD is up by more than 1% in 2026 and has gained nearly 10% in the last year
- The 1.3700 appears to be a technical barrier that the pair has failed to break through multiple times in the last two weeks
- UK services data, consumer inflation and US jobs data are central to the pair's broader trajectory in 2026
Since the beginning of 2026, the GBP/USD pair performed well in the forex market, increasing by over 1% by mid-February. But things changed this week. After trying to reach 1.3700, the pair stalled, with losses in the last three sessions. What’s causing this slowdown?
Why the Pound Dominated the USD in the Last Year
The pound’s strength in 2025 was mainly due to the dollar’s weakness, not the pound’s own strength. The USD index dropped 10%, the worst since 1979, because of a poor US economic outlook and portfolio diversification, according to J.P. Morgan‘s July 28, 2025, report on currency volatility.
Also, the Federal Reserve started cutting rates, but the Bank of England (BoE) didn’t move as much. Recent data from the Office for National Statistics (ONS) showed that UK inflation was 3.6% at the end of 2025, above the 2% target. Because of this inflation, the BoE kept the Bank Rate at 3.75% during their February 5, 2026, meeting, giving the pound a yield bigger than the dollar’s.
Is a Reversal in the Making?
The Cable’s struggle this week, failing to break through 1.3700, might mean a temporary pullback, not a full reversal. The pound’s strength might be a growth illusion. The IMF raised UK growth estimates to 1.3% for 2026, making it a top G7 performer, but this growth depends a lot on consumer services.
The rejection at 1.3700 shows that the market is starting to wonder if the UK’s economy is strong because of delayed inflation normalization. If US inflation is higher than expected, the Fed might stop cutting rates. If that happens, the interest rate difference that helped the pound could disappear. If the US dollar becomes stronger from tariffs and growth, it could reverse the trend if UK inflation slows down faster.

GBP/USD Forecast
The GBP/USD pair is currently showing signs of bearish exhaustion after failing to sustain a break above the 1.3700 resistance zone. Its RSI at 52.95 is neutral. Immediate support is at 1.3586, with a stronger floor at 1.3568. The first resistance is at the 10-day EMA at 1.3633, but if the momentum is strong, it could break through and test 1.3664.
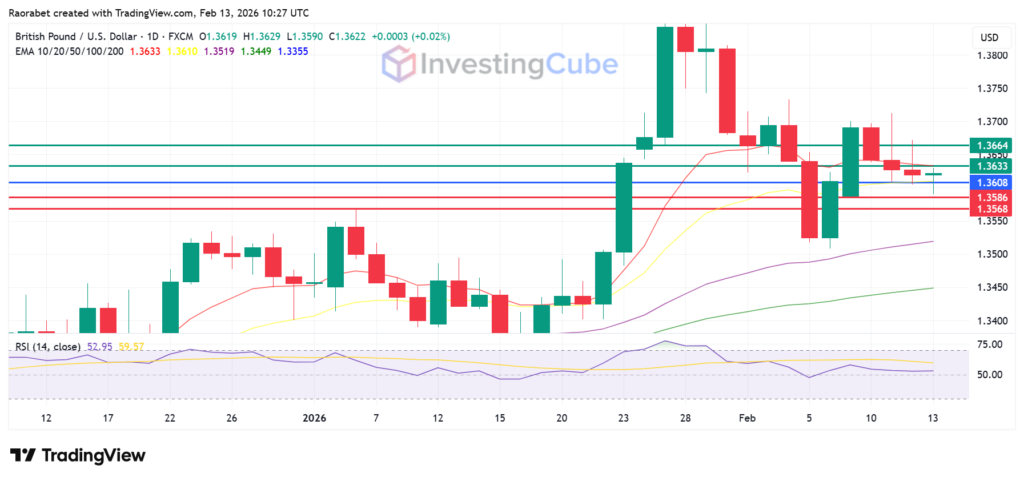
GBP/USD FX pair on the daily time frame with key levels of resistance and support on February 13, 2026. Created on TradingView
The 1.3700 level is a psychological and historical resistance zone. Traders took profits following a strong January rally, especially as US jobs data came in stronger than expected, briefly reviving demand for the US dollar.
The main reason was the difference in interest rates. The Fed cut rates to help the US economy, while the Bank of England kept rates higher to fight UK inflation.
Not necessarily. Technically, it appears to be a healthy correction. If the pair drops and stays below 1.3474, it would mean the positive outlook for 2026 is wrong.