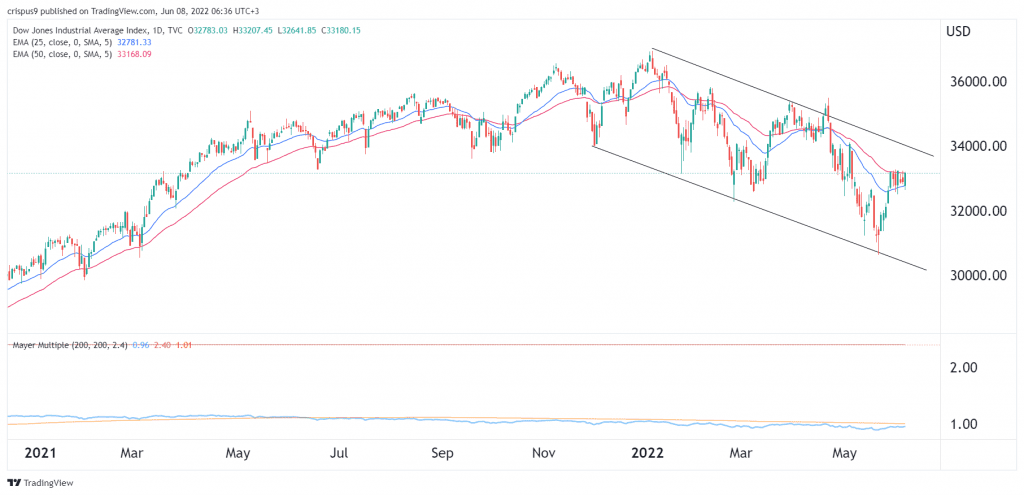
The Dow Jones index tilted lower in the futures market as investors focused on the margin problem. The DJI index rose by over 265 points on Tuesday after Target warned about its inventory problem. However, futures tied to the index have retreated by 100 points to the current $33,100. It is now about10% below its highest level this year.
There are several reasons why the Dow Jones index has been under pressure in the past few months. First, there are concerns about the American economy, with some analysts expecting a recession. A recession leads to poor consumer spending, which affects companies’ income.
Second, there are fears that the Fed will continue hiking interest rates at the fastest pace in years. The Fed is expected to hike interest rates by 0.50% in its upcoming meeting. Third, the Dow Jones index is falling as worries about margins continue as inflation rises. On Tuesday, Target warned that it will start offering discounts and cancel orders because of its inventory problem. Most importantly, the strong US dollar will reduce Dow Jones earnings.
Microsoft has already warned about the imminent earnings hit since the dollar has dropped against most currencies like the euro and yen. Many Dow Jones constituents have lagged the market this year. The worst-performing stocks in the index are Walt Disney, Boeing, Cisco, Home Depot, Nike, Salesforce, and Microsoft.
All these have fallen by more than 20% this year. Still, these are high-quality companies that will likely rebound in the coming years. On the other hand, the best Dow Jones constituents are firms like Chevron, Dow, Merck & Co, Travelers, Caterpillar, and Amgen.
Dow Jones forecast
The daily chart shows that the Dow Jones index formed a hammer pattern in May. In price action analysis, this pattern is usually a bullish sign. It has risen substantially since then and is trading at $33,180. It is attempting to move above the 50-day and 25-day moving averages
Also, the price is above the descending trendline shown in black and has formed a bullish flag pattern. Therefore, the index will likely keep rising as bulls target the key resistance level at $34,000. A drop below the support at $32,660 will invalidate the bullish view.


