Dow Jones index is feasting on the increased risk appetite in the US stocks. On Tuesday, Dow futures hit a new all-time high after breaking above 36,832 points. Analysts are expecting the Dow Jones Industrial Average to follow as the markets open on the CPI day.
All eyes are on the November CPI data release and the FOMC decision which are scheduled for this week. The inflation data will show the rate of increase in the month of November. While the analysts expect the downtrend to continue, inflation still remains well above the Fed’s target of 2%.
Dow Jones Index closed its Monday session after rising 0.43%. This also marked the start of the seventh consecutive week of uptrend for the benchmark index of the US blue-chips. On Tuesday, the E-mini futures extended gains by making a new all-time high before having a brief correction. As a result, the futures stood at 36,815 at press time.
The back-to-back pauses in the rate hikes by the US Federal Reserve in the last two FOMC meetings and the recently released economic data are pointing towards another pause in this week’s meeting. However, analysts will be more interested in the Fed’s tone to have hints of potential rate cuts.
Along with the US Fed, the European Central Bank and Bank of England are also expected to make interest rate decisions on Thursday. The monetary policies of the three Western central banks may collectively impact the Dow Jones Index forecast for the coming months.
Dow Jones Index Forecast
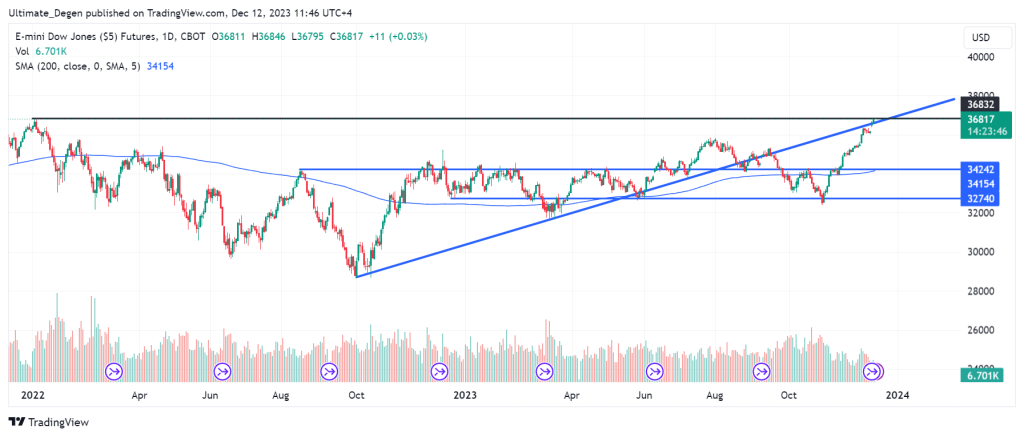
The following chart shows that the futures tracking Dow have not only hit a new yearly peak but also their highest level in history. While the S&P 500 index and the Nasdaq 100 index are yet to make new all-time highs, they are inching very close to achieving the feat.
However, there is a minor divergence on the Money Flow Index (MFI) indicator, along with multiple resistances around the 36,800 points level. These confluences might test the bulls’ ability to clear the supply that lies around this level in the coming days.