
- Tesla maintains a strong balance sheet, with a low debt-to-equity ratio and solid liquidity, highlighting financial stability.
- However, the stock trades at a very high valuation and carries elevated volatility, meaning expectations are stretched and price swings can be sharp.
- Recent headlines including robotaxi expansion projections and the North America Sales Chief (Raj) departure are key catalysts influencing short-term sentiment and share price direction.
TSLA stock advances by 1.89% or 7.89 points, while on the pre-market front, it slips 0.47% or 1.91 points. This surge came on the heels of mixed news about the departure of Tesla‘s North America Sales Chief. Raj Jegannathan has been working for TSLA for 13 years. On the other hand, the CEO Elon Musk affirmed that the robotaxi fleet could double monthly and cover a quarter to half og U.S. by year-end. Musk projected a continued doubling of the robotaxi fleet, though timeline skepticism remains.
Major Headlines Moving TSLA Stock This Week:
- CEO Elon Musk affirmed that Tesla will accelerate production volume of the all-electric semi in 2026. If this move is accomplished, it would add a higher margin and support expectations for vehicle volume recovery.
- Tesla plans active hiring alongside a concrete 2028 timeline to reach a 100-GW U.S. solar manufacturing target, signaling a tangible expansion of its energy business. This expansion is expected to enhance long-term revenue diversification and support institutional buying, as noted in TSLA’s announcement.
- The departure of Tesla’s VP Raj Jegannathan, who was responsible for IT, AI-infrastructure, business apps, and was leading sales/service in North America for a long time. The turnover in such sensitive positions at sales/IT roles can raise short-term execution and organizational continuity concerns.
- Competition is rising as BYD announced advanced battery technology that could compete with Tesla’s battery in terms of cost and feature advantage. On the other hand, Rivian’s lower-priced R2 SUV is being road-tested. This could increase the upside risk to Tesla’s market share and margin outlook in key segments.
TSLA Stock | Updated Analyst Ratings and Consensus Price Target:
- TD Securities gave Tesla stock a “buy” rating in a research report on January 29. It raised Tesla’s price target from $509 to $519.
- The Royal Bank of Canada (RBC) assigned Tesla stock an “outperform” rating and set a price target of $500.
- Roth MKM sets a price target at $505 for Tesla shares and maintains a “Buy” rating in a report on October 23rd.
- Finally, Truist Financial assigned a Hold rating, lowering the price target from $439 to $438.
The Overview of Analyst Consensus:
Tesla shares received a “Buy” rating from 17 analysts, a “Hold” rating from 14 analysts, and a “Sell” rating from 9 analysts. The Consensus rating is “Hold,” while the average price target is $403.92.
Tesla Stock Rises 1.9%: A Look at the Company’s Financial Ratios
Today, Tesla stock opened at $435.21. The 52-week low for Tesla stock is $215, and the 52-week high is $498.83. For the company’s financial ratios front, Tesla’s debt-to-equity ratio is 0.08, and its quick ratio is 1.77. According to YahooFinance.
This indicates that the company relies very little on debt compared to shareholders’ equity. For every $1 of equity, Tesla carries just 8 cents of debt. This suggests a conservative capital structure and relatively low financial leverage. This reduces balance sheet risk, especially during higher interest rates. This ratio gives Tesla the flexibility to raise additional financing in the future if needed.
The quick ratio of 1.77 shows a strong short-term liquidity. A ratio above 1.0 is generally considered healthy, so 1.77 suggests Tesla can comfortably meet its obligations without relying on selling inventory.

Additionally, Tesla’s current ratio of 2.16 further reinforces this strength. The current ratio includes all current assets relative to current liabilities. A ratio above 2.0 is typically seen as solid, indicating a strong working capital position and operational flexibility.
Tesla’s price-to-earnings (P/E) ratio of 393.71 is exceptionally high, indicating that investors are paying nearly 394 times the company’s current earnings per share. Such an elevated multiple typically reflects strong growth expectations and market confidence in Tesla’s long-term potential.
With a beta of 1.86, Tesla is likely to experience amplified price swings, making it attractive to active traders but potentially riskier for conservative investors. Overall, these metrics portray Tesla as a high-growth, high-valuation, and high-volatility stock.
The Technical Outlook for TSLA shares:
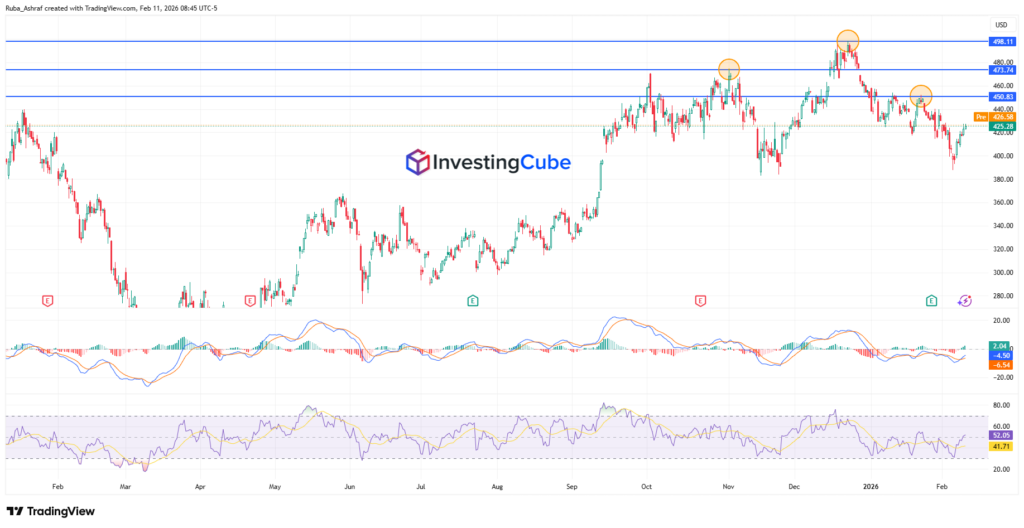
The chart shows that momentum has cooled after failing to sustain a breakout above key resistance. Price recently tested the upper resistance zone around $498, where sellers stepped in, forming a rejection near prior highs. This level now stands as a major resistance barrier. Below that, the $473–$480 zone and the $450 area act as intermediate resistance levels, both previously highlighted by multiple rejections (circled on the chart).
On the downside, price is currently hovering around the $423–$425 region. A sustained move below this level could expose the stock to deeper levels toward the psychological $400 zone. The MACD shows signs of recovery after a bearish phase. The RSI, currently around the low 50s, reflects neutral momentum.
Tesla maintains low debt (0.08 debt-to-equity) and strong liquidity (current ratio 2.16), but its very high P/E (393.71) and PEG (13.98) suggest investors are pricing in significant future growth, increasing valuation risk.
TSLA is being influenced by robotaxi expansion expectations, competitive pressure from BYD and Rivian, executive leadership changes, and technical levels around $450 resistance and $420 support.