
Silver price extended its fall by more than 10%, trading around $74.16 per ounce. One of the main drivers of the two-day rebound is the lack of liquidity due to rising margin requirements by the CME Group.
During the European trade on Thursday, New York Silver futures traded 7.6% lower to $78.01 per ounce. Meanwhile, spot silver slipped 11.1% to $78.56 per ounce. During the last month, the white metal surged and reached an all-time high above $120, then it plummeted more than 30% earlier on Friday.
Spot silver on Friday edges up over 5% at $74.94 after a significant fall during the last week. However, silver is still under selling pressure due to several factors.
Key Drivers Behind the Silver’s Recent Price Sell-Off :
- According to Saxo Bank’s Justifications, the Chinese futures market and the CME faced heavy selling pressure after the silver price fell and broke below the resistance level at $90.50.
- They also added that silver prices are likely to continue trading volatily in both directions until the market plumbing improves with better volatility and liquidity.
- The U.S. dollar rebounded by 0.3% to 97.89, making dollar-dominated commodities more expensive to overseas buyers.
- The rise in metal prices over the years was driven by central banks’ purchases and strong inflows into exchange-traded funds. This was because investors’ behavior moved away from sovereign bonds and currencies in favor of hard assets like Gold and silver.
- Last week’s drop in metals was driven by a strong US dollar, so investors moved toward profit-taking.
- This move was also influenced by Trump’s nomination of Kevin Warsh as the next Federal Reserve Chair. Warsh is seen as more aggressive on interest rates.
- As a result, silver fell much more sharply than gold, while low liquidity in the London market continues to cause bigger and faster price swings.
- Goldman Sachs warned that the limited supply of silver has squeezed conditions. This means that prices tend to rise quickly when demand increases and fall so fast when selling pressure returns. At the same time, CME Group raised margin requirements, making it more expensive to hold silver positions. This usually puts pressure on prices and reduces trading activity.
What Does the Gold-to-Silver Ratio Signal to Investors?
The gold-silver ratio measures the relative value between gold and silver. It indicates how many ounces of silver are needed to buy one ounce of gold. The gold-to-silver ratio is often used to see whether silver is cheap or expensive compared to gold. In May 2024, the ratio was around 86.5, while silver was trading below $40 per ounce. By April 2025, the ratio jumped to a peak near 105.9, even though silver was still below $50. That gap was one of the main reasons we expected silver to start outperforming.
When the gold-to-silver ratio stays high—usually above 80—it signals that silver is undervalued relative to gold. Historically, this has often been followed by periods where silver catches up and moves faster than gold. As the ratio starts to fall from these high levels, silver tends to lead the move higher.
The ratio does not give an exact price target, but it helps explain the direction. Once the ratio drops toward 50:1, silver is no longer considered cheap and has often traded near cycle highs.
Last week, the ratio bottomed around 44, while now it’s up to 66:1. This suggests that silver has moved from a catch-up phase into a stronger momentum-driven rally, supporting a bullish outlook rather than a short-term move.
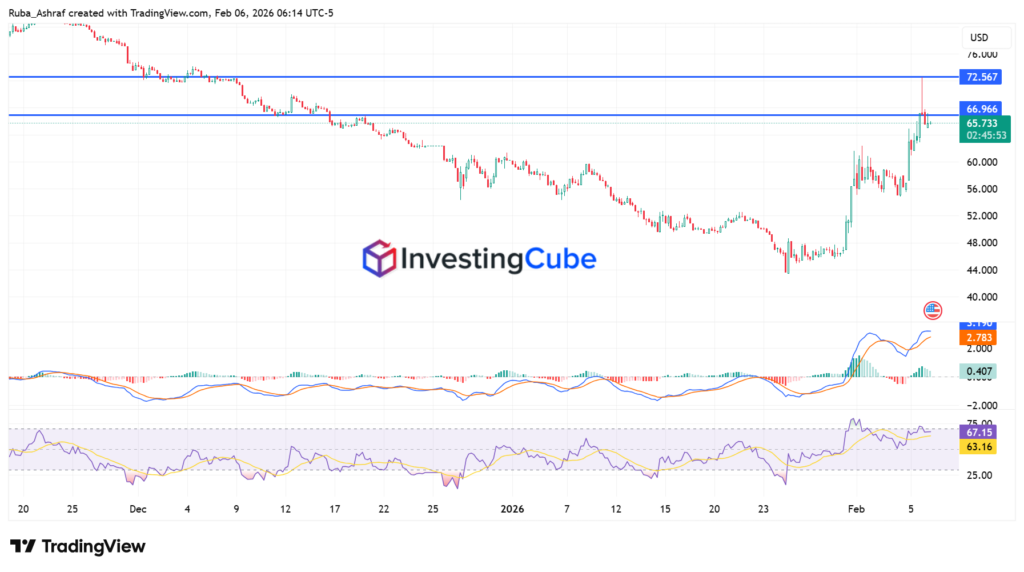
The chart shows that the gold-to-silver ratio was in a strong downtrend for several weeks, confirming that silver was outperforming gold during that period. Recently, the ratio rebounded to the 44-45 area, suggesting some short-term profit-taking in silver after the strong rally. Overall, as long as the ratio stays below the 67 resistance zone, the broader structure still favors silver outperforming gold.
The Technical Outlook for Silver Price (XAG/USD):
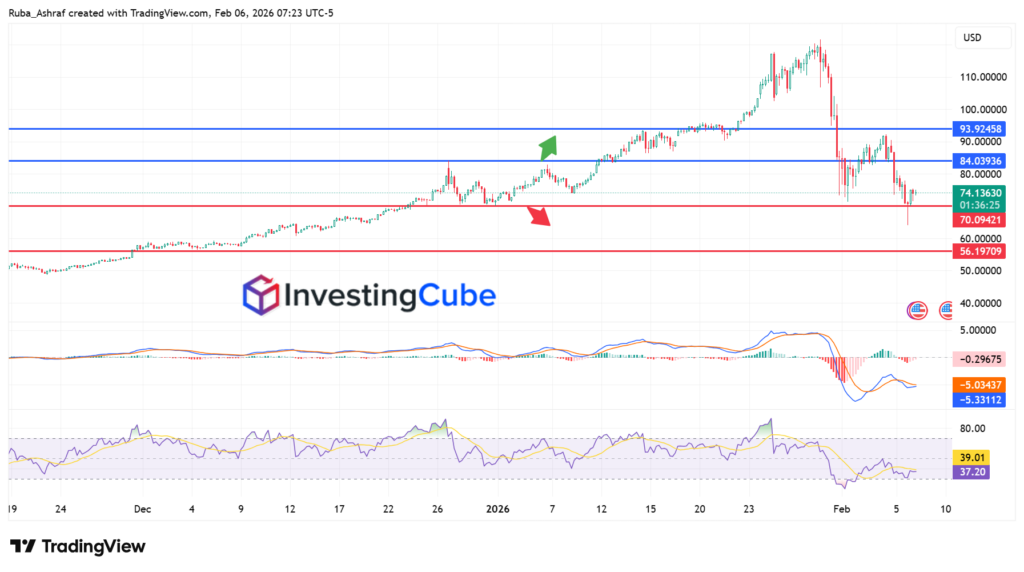
The chart shows that the price has been in a strong uptrend since mid-December, moving higher with periodic consolidations gradually. The key resistances are marked in blue horizontal lines at around $84.04 and $93.92. The key support levels at $70.09 and $56.19 are marked in red lines.

Recently, after reaching a peak above $100, the price sharply corrected, testing the support around $70.09. Currently, it’s attempting a minor rebound near $74.53, indicating that buyers are stepping in at this support zone.
The MACD confirms a strong downward momentum. However, in the last few sessions, the histogram bars are shortening, indicating that the bearish momentum may be slowing, potentially leading to a consolidation or a minor recovery in the near term.
The RSI supports this view as it recently dipped into oversold territory below 30 and has started to rise slightly. This suggests that the market is recovering from oversold but still lacks a strong bullish trend.
The consolidation period would be between the resistance of 84.03 and the support of 70.09. A decisive breakthrough above the resistance level could pave the way toward the $90.0 level again.
On the other hand, a decisive break below the support level of 70.09 could pave the way toward the 60.00 level.
Silver prices are driven by industrial demand, investment demand, inflation expectations, and geopolitical or economic uncertainty.
Yes, like gold, silver can act as a hedge against inflation and currency fluctuations, though it tends to be more volatile.
It’s the number of ounces of silver needed to buy one ounce of gold, used by traders to identify potential buying or selling opportunities.