

- The U.S. Dollar hit fresh yearly highs after the FOMC signaled a "green light" for bulls, while the Euro collapsed under the weight of a $120 oil shock.
- Sterling defied the broader "Risk-Off" trend after a unanimous Bank of England vote triggered a massive hawkish repricing in the Gilt curve.
- A volatile 200-pip reversal in USD/JPY from the 160.00 handle has left traders on high alert for a Bank of Japan ambush at the March 23 open.
The third week of March 2026 was defined by a forceful shift in global monetary dynamics as the “inflation monster” forced central banks into a hawkish corner. The U.S. Dollar emerged as the primary beneficiary of a “green light” from the FOMC, while a surprise unanimous shift from the Bank of England provided a rare moment of resilience for Sterling.
As Middle East tensions pushed Brent Crude oil toward the $120 mark, the resulting “risk-off” sentiment redrew the technical map for major pairs heading into the March 23 open. While XAU/USD continues to hold its ground as a primary geopolitical hedge, which I covered in depth in today’s Gold Weekly Recap, the currency space was dominated by intervention anxiety and a widening divergence between the Fed and its G10 peers.
Weekly performance overview
- Winners: U.S. Dollar (Safe-haven dominance following FOMC), Japanese Yen (Strong recovery on intervention fears).
- Losers: EUR (Energy-driven growth fears), Emerging Market Currencies (e.g., INR).
- Commodities: WTI Crude Oil experienced a sharp rise due to geopolitical supply concerns, hitting multi-year highs near $92.66.
US Dollar (DXY) weekly recap: FOMC “green light” ignites rally
The US Dollar Index (DXY) remains firmly in the driver’s seat following Wednesday’s FOMC rate decision. While the Fed held rates at 3.50%–3.75%, the accompanying rhetoric initially pushed the index to test the 100.40 region. Regarding price action, the DXY is currently testing the 99.38–99.45 zone, attempting to flip previous resistance into a support floor.
Although the MACD shows a short-term loss of momentum, the technical structure remains a bullish flag on the 4-hour chart, suggesting the broader uptrend is still intact despite the late-week softening in yields.
DXY key technical levels to watch:
- Support: 99.35 This is the immediate area where the price is currently finding buyers, aligned with the 9-period Moving Average and previous structural resistance.
- Invalidation: 98.73 As long as the price stays above this prior higher-low by the end of the week, the overall bullish trend is still pointing upward.
- Resistance: 100.40 The Dollar needs to close a full day above this specific yearly high to prove the uptrend has officially restarted.
- Next target: 101.99 If the price breaks through the 100.40 ceiling, this is the next major objective as geopolitical fears sustain.
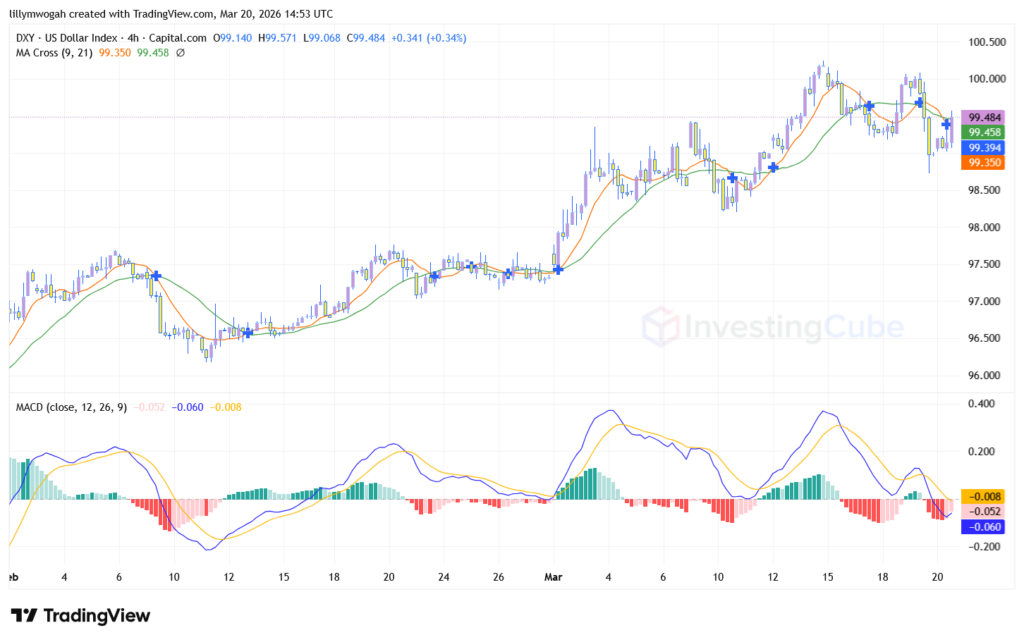
DXY Outlook: The market has abandoned hopes for immediate easing, with Fed Fund Futures now pushing the first potential rate cut back to July. While the DXY is currently seeing a “cooling off” period near 99.48, the momentum is still favor of the bulls heading into a heavy week of central bank headlines, provided the 99.35 floor holds.
USD/JPY Weekly Recap: The 160.00 “Line in the Sand” Reversal
USD/JPY acted as the primary push point for the DXY basket this week. The pair saw intense drama, piercing toward the 159.70 handle before a decisive 200-pip move lower.
The weekly price action saw a sharp rejection of these yearly highs, but bulls managed to find support at the 158.94 level, keeping the structural uptrend alive despite the volatility. Whether this was organic profit-taking or covert BoJ intervention remains unconfirmed, but the region just shy of 160.00 is now the definitive “line in the sand” for the market.
USD/JPY key technical levels to watch:
- Support: 157.52 This is the immediate floor (the blue line below current price). A drop below this level suggests the parabolic rally is over and a deeper correction toward 155.50 is underway.
- Invalidation: 154.01 This is the “make or break” point for bulls on your chart. Falling below this level would signal a full structural trend reversal.
- Resistance: 159.70 Sellers and potentially the BoJ are defending this peak. A daily close above this is needed to overcome intervention fears and target the 160.00 big figure.
- Next target: 161.85 If buyers reclaim control and the BoJ remains sidelined, this remains the secondary psychological objective.
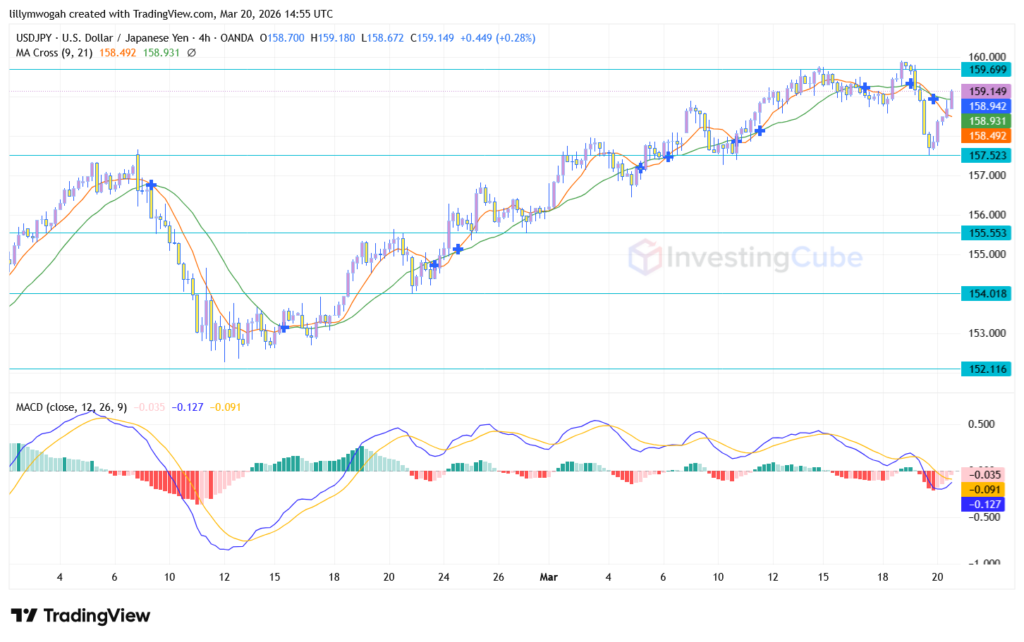
USD/JPY Outlook: The immediate bias is leaning toward a pullback as indicated by the bearish MACD crossover. Watch for Bank of Japan rhetoric at the Sunday open; if the 158.94 support fails, we could see a swift move toward the 157.52 horizontal support zone.

EUR/USD weekly recap: Euro buckles under energy pressure
The Euro hit fresh lows this week, bottoming near 1.1414 as the “perfect storm” of Dollar strength and energy volatility hit the bloc.
EUR/USD price action: The pair decisively broke below the 1.1500 psychological support and reached a low of 1.1414 before a minor relief bounce. While the MACD shows a slight bullish crossover attempt, the price remains capped by the 9 and 21-period Moving Averages (orange and green lines), confirming that sellers are still in control.
EUR/USD key technical levels to watch:
- Support: 1.1414 This is the primary floor on your chart and represents the year-to-date low where buyers recently stepped in.
- Invalidation: 1.1650 A break above this blue horizontal line would shift the medium-term trend from bearish back to neutral.
- Resistance: 1.1522 This is the immediate “sell zone” (marked by your blue line). Buyers need to push past the 21-period MA here to exit the danger zone.
- Next target: 1.1380 If the support at 1.1414 fails, this is the next major objective for the bears as the energy shock continues.
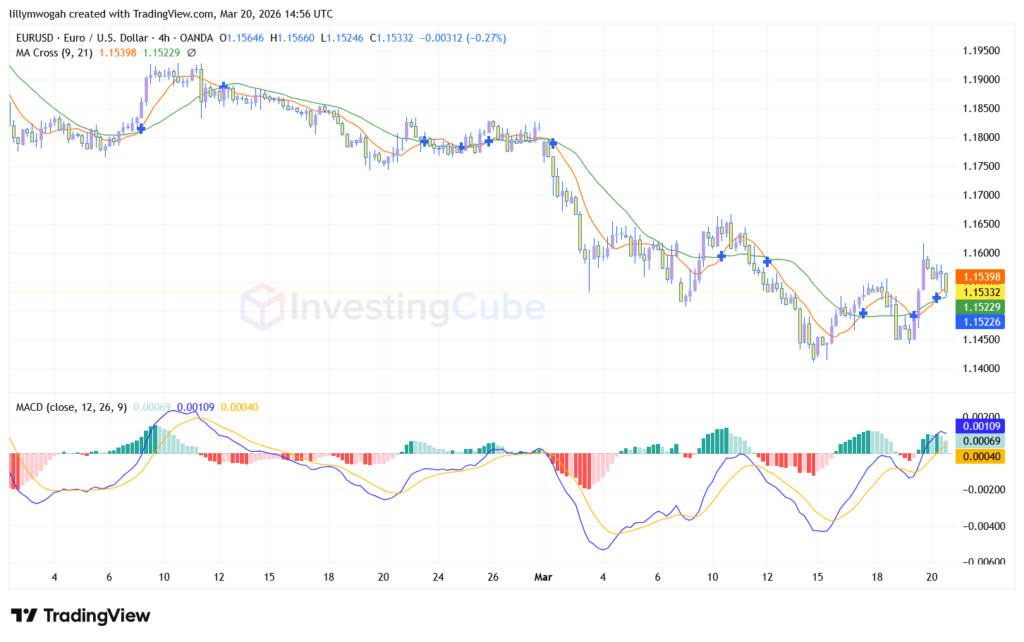
EUR/USD outlook: The outlook remains bearish as we head into the March 23 open. The market is pricing in a stagflationary scenario for the bloc. Unless the pair can reclaim and hold above the 1.1522 level, the path of least resistance remains toward a re-test of the 1.1414 lows.
GBP/USD weekly recap: Unanimous BoE hold triggers reversal
GBP/USD was the standout resilient pair this week, delivering a bullish reversal on Thursday.
GBP/USD price action: The “Cable” successfully broke through the 1.3283 resistance level and reached as high as 1.3483 following the 9-0 BoE vote. While the price has dipped slightly toward the close, the MACD shows a strong bullish surge, and the price remains above the 9 and 21-period Moving Averages, suggesting a change in short-term sentiment.
GBP/USD key technical levels to watch:
- Resistance: 1.3483 This is the primary defense line for sellers (your top blue line). A daily close above this confirms a full breakout.
- Invalidation: 1.3199 As long as price holds above this deep support floor, the recent bullish reversal remains technically intact.
- Support: 1.3283 This is the current “pivot” zone. This prior resistance has now flipped into a supportive floor that bulls must defend.
- Next target: 1.3575 If the 1.3483 hurdle is cleared, this blue line is the next major objective for the bulls to confirm a trend shift.
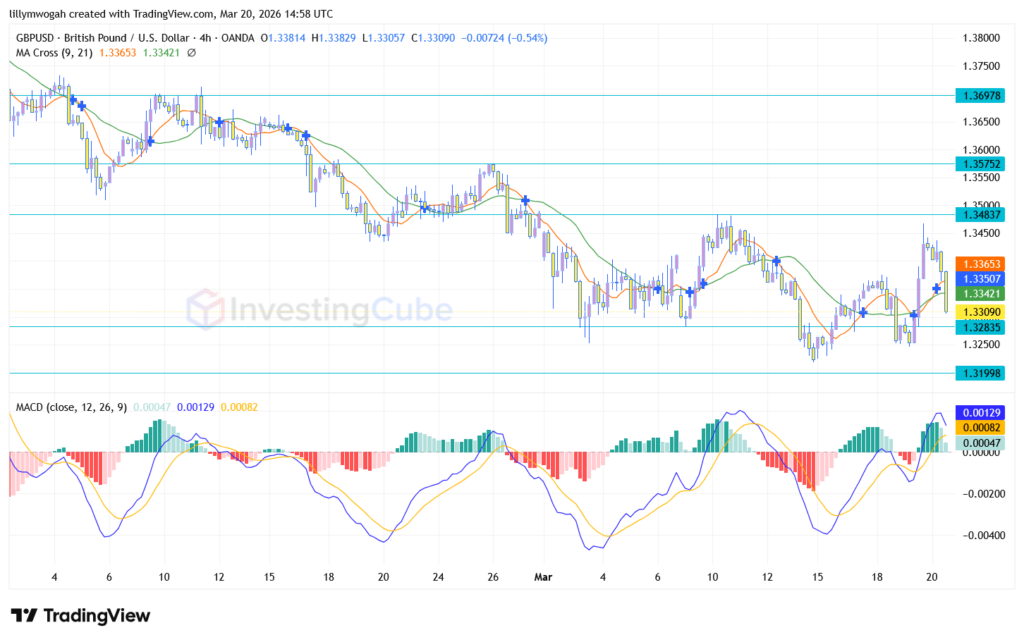
GBP/USD outlook: Momentum indicators are currently the strongest in the G10 space for the Pound. The path of least resistance has tilted sideways-to-higher. We are watching the 1.3350 area (current price) closely; if bulls can maintain this level through the Sunday open, a test of 1.3483 is likely early in the week.
Final conclusion & strategic outlook (week of March 23)
As we transition into the March 23 weekly open, the market focus remains on the “Inflation Monster” and the aftershocks of the central bank bonanza. The US Dollar breakout is no longer just testing resistance, it is actively redefining the 2026 price floor. Following a week where the Fed gave a “green light” to hawks and the BoE pivoted unanimously, the macro landscape has shifted toward sustained dollar dominance.
Traders should pay close attention to the following key data points and speakers:
- February PCE price index (Friday, March 27): This is the high-stakes data point of the week. After the hot January print, the market is awaiting the February figures to see if the $120 oil shock is already feeding into core inflation. This will be the ultimate arbiter of the Fed’s “higher for longer” trajectory.
- Central bank speakers: Keep a sharp eye on the wires for the ECB’s Pedro Machado on Wednesday and various Fed officials throughout the week. Their commentary on how they intend to balance cooling growth with the secondary inflation wave from energy prices will be critical.
- Monday open volatility: With the DXY and USD/JPY sitting at critical technical junctions (99.35 and 158.94 respectively), the Sunday night gaps will provide the first confirmation of whether the “Risk-Off” move is accelerating or if we are in for a period of consolidation.
Bottom line: Prioritize capital protection as volatility remains at multi-year highs. The primary focus for the week of March 23 remains on whether the DXY can sustain its momentum above the 100.40 handle and if the 159.70 “intervention zone” on USD/JPY continues to act as an impenetrable ceiling.
