
Stock markets in London open higher today, ahead of key UK economic data, including GDP, trade balance, and industrial production figures. Yesterday, the FTSE 100 rose on the surge in commodity prices, including gold and oil, along with the higher-than-expected US NFP. On Thursday, 12 February, the FTSE 100 opened 0.5% higher at 10519.02.
This article explores the latest key UK economic releases and what they reveal, highlights FTSE 100–related developments, and provides a technical outlook for the index.
FTSE 100 | UK Preliminary GDP Release Overview:
According to the UK Office for National Statistics, the UK economy expanded by 0.1% in the fourth quarter of 2025, matching the growth recorded in the third quarter. Gross domestic product rose by 1.0% on an annual basis, below expectations of 1.2%. For 2025 as a whole, the economy grew by 1.3%, compared with 1.1% growth in 2024.
UK GDP Growth monthly:
- October 2025: GDP contracted by 0.1%, reflecting a temporary slowdown in economic activity at the start of the final quarter.
- November 2025: The economy rebounded with 2.0% growth, signaling a short-term recovery following October’s decline.
- December 2025: GDP rose by 0.1%, indicating modest but continued expansion toward the end of the year.
- Over the quarter, production increased by 1.2%, making it the primary contribution to overall economic growth.
- The service sector recorded no growth during the quarter, suggesting stagnation in the UK’s largest economic component.
- Construction activity declined by 2.1%, highlighting persistent weakness in the sector.
- Real GDP per Head Quarterly: On a per-person basis, output fell by 0.1% during the quarter, pointing to slight pressure on individual economic performance.
- Real GDP per Head (Year-on-Year): compared to the same period last year, real GDP per head increased by 0.6%, reflecting a moderate improvement in living standards.
- Overall, in 2025, GDP expanded by 0.1%, indicating steady but moderate annual economic growth.
Market Reaction:
The immediate reaction for the Pound Sterling is edging slightly lower. At the press time GBP/USD pair was down 0.03%, trading around 1.3615.
Recent Developments Among FTSE 100 Companies:
- Schroders Agrees 9.9 billion Sale to Nuveen:
Schroders will be acquired by Pantheon LLC (Nuveen) in an all-cash deal worth up to £9.9 billion, giving shareholders up to 612p per share, which is a 34% premium. The transaction is expected in Q4 2026, after which Schroders’ shares will stop trading in London. Separately, Schroders reported strong 2025 results, with assets under management up 6% to £823.7 billion and profits rising over 20%. - British American Tobacco:
The company reported higher profits in 2025, with pretax profit rising to £9.86 billion and diluted EPS jumping to 349.1p. Revenue slightly fell to £25.61 billion but rose 2.1% at constant exchange rates. Smokeless products now account for 18% of revenue, adding 4.7 million consumers. The company raised its dividend by 2% and plans a £1.3 billion share buyback in 2026, expecting 3–5% revenue growth and 4–6% adjusted profit growth next year. - Unilever:
Unilever reported 2025 pretax profit of €8.69 billion, up from €8.37 billion, despite revenue falling 3.8% to €50.50 billion due to disposals and currency effects. The company declared a €0.4664 interim dividend and plans a €1.5 billion share buyback.
Its spin-off, Magnum Ice Cream, posted pretax profit of €447 million on flat revenue of €7.9 billion, down from €747 million the previous year.

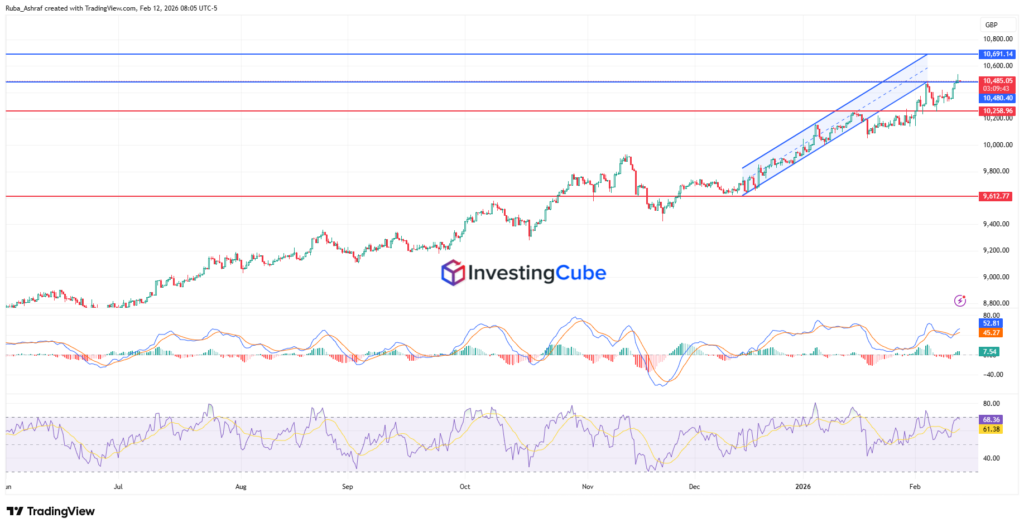
FTSE 100 Technical Outlook | Key Levels to Watch:
The FTSE 100 is currently trading within a well-defined upward channel, indicating a strong bullish trend over the past few months. The price is currently near the channel’s lower boundary, which has acted as a support level over the past few days and last month. If the price fails to break out and close above 10,486 on the 4-hour chart, it could decline toward the next key support at 10,258.
On the bullish side, a decisive breakout above 10,490 could open the way toward resistance levels at 10,600 and then 10,691. The key support reinforcing the index above 10,300 is 10,258, while the lower support level marking the start of the ascending channel is 9,612.
The MACD shows a bullish momentum while the RSI sits around 68.5, close to overbought territory. This signals that the index may face short-term consolidation before continuing higher. Overall, the chart suggests a strong uptrend, but traders should monitor the key resistance at 10,691 and support at 10,258 for potential breakout or pullback opportunities.
Strong GDP growth boosts investor confidence and can push the FTSE 100 higher, while weaker-than-expected GDP may weigh on the index.
The lower support is at 10,258, with major resistance around 10,600–10,691. A break above or below these levels can signal the next trend direction.