

- Ethereum price has been on a sharp downtrend in the last month and market fundamentals and on-chain metrics point to deeper troubles.
Ethereum price has fallen sharply, dropping about 25% in the last month. Such a drop isn’t rare after a major rally, but the rate at which this one has happened has investors wondering what’s going on. The reasons include a mix of difficult economic times, some whale investors selling off, and a sharp on-chain liquidity crunch.
Market Fundamentals and Macroeconomic Pressure
A major factor impacting the crypto market, plus Ethereum, is the hawkish stance by central banks and an uncertain global economy. For instance, the CMC FedWatch Tool shows that expectations for a December interest rate cut by the Federal Reserve have gone down. The higher-for-longer interest rate environment makes investments in riskier assets like cryptocurrencies less appealing, so traders are moving their money to safer investments.
On-Chain Metrics and Liquidity Shocks
Looking at on-chain data, there is proof the drop was made worse by a liquidity squeeze across the market. The crypto space recently suffered a catastrophic liquidation event that wiped out billions in leveraged positions. But, longer-term on-chain data suggests some stability that goes against the immediate price drop.
Analysis of Santiment data reveals that Ethereum’s 30-day Market Value to Realized Value (MVRV) ratio has dropped into what analysts term an “opportunity zone.” Historically, accumulation in this zone has often preceded short-term recoveries. Also, the upcoming Fusaka Upgrade, the biggest since The Merge could provide more incentive to buy. The upgrade will introduce 12 EIPs, focusing on enhancing scalability, transaction cost and user experience.
DeFi, which is central to Ethereum’s growth, has seen strong highs and deep lows this year. The sector dominates with over $74 billion in total value locked (TVL), but the Balancer breach showed weaknesses, leading to a sharp TVL drop as users pulled out funds to avoid liquidations. DefiLlama metrics show a 7-10% TVL drop post-hack, exacerbating ETH’s slide as forced sales flooded exchanges.

Ethereum Price Chart
Ethereum’s daily chart shows a bearish breakdown below the 200-day EMA at $3,597, and the pivot is currently at $3,500. The ADX reading at 28.62 affirms the strong downward trend.
A continued control by the sellers could lead to deeper slides to the support at $3,181 and potentially lower to $2,985. However a breach of $3,500 could take the action higher to the 20-day EMA of $3,736. The downside narrative will be invalid beyond that and ETHUSD could go on to test the psychological $4,000, with a clean break signaling reversal.
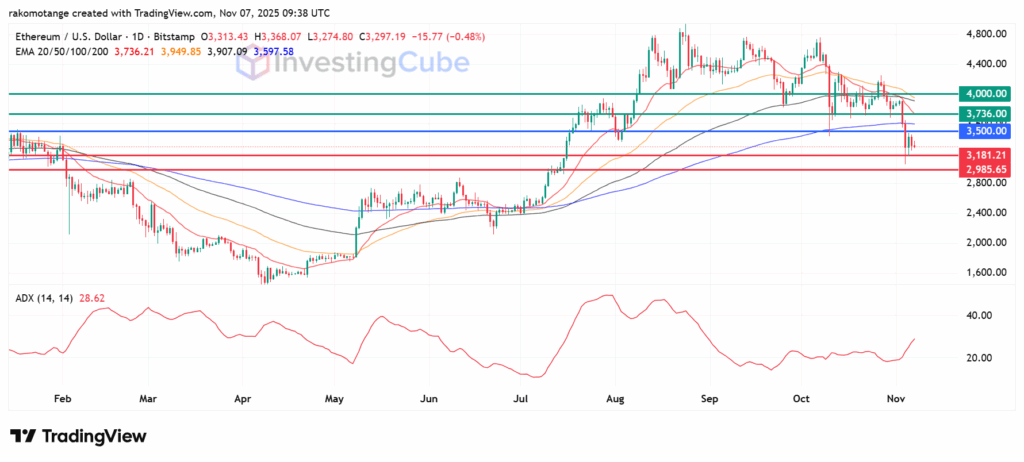
ETHUSD chart on November 7, 2025. Source: TradingView
DeFi’s TVL, currently worth nearly $75 billion anchors Ethereum’s utility, but the Balancer breach caused a sharp TVL pullback as users fled. This triggered forced ETH sales.
The MVRV ratio at -10.5% signals undervaluation, and that is historically a rebound zone. If you combine that with whale accumulation and upcoming upgrades, the dip could be a short-lived test.
The sharp drop was magnified by a liquidation cascade across the market. Rapid price movement led to automatic closure of billions in leveraged long positions. This forced selling intensified the downward pressure, creating a liquidity shortage.