

- Ethereum price fell below the psychological $4,000 mark and went on a four-day losing streak. But the weekend could see ETHUSD recover losses.
This week has not been easy for Ethereum. It fell below the crucial $4,000 level after touching highs of about $3,979 late last week. As of early November 1, it had clawed its way back up to around $3,850.
As of this writing, ETH/USD is precisely at what chartists call the neckline of the double-top pattern. This is the important support level between $3,900 and $4,000 where two peaks earlier this month turned down. The big issue on everyone’s mind is whether the bulls can turn things around over the weekend or if a bigger pullback is coming.
Can ETH/USD Reverse During the Weekend?
The weekend usually has less liquidity, which might make prices fluctuate more in either direction. For a convincing reversal to happen, buyers need to step in to protect the current price level. More crucially, they need to push the price back above the neckline in a major way. A successful defense of the support zone, along with a lot of spot buying, might start the much-needed relief rally, which would aim to bring the price back to $4,000 and higher.
But is there actual proof that a reversal is likely during the weekend? First of all, the price activity has been largely about testing and defending. On October 30, Ethereum price dropped to $3,681 but then rose by 0.55% in 24 hours, creating an inside day on the daily chart. This is a typical sign of consolidation before a price rise.
According to on-chain analytics site Santiment, there has been a substantial rise of major short positions forming up across exchanges. This implies that fear sentiment is currently prevalent among traders. In the past, crowded short positions have often been a sign of an adverse event happening, causing a “short squeeze” that can cause prices to rise very quickly. Basically, when everyone is betting on a decrease, an upward nudge forces short sellers to buy back their holdings, which makes the bounce happen faster.
Technical Analysis
After going down for a week, ETH/USD tests the double-top neckline at $3,900–$4,000. Key support is at $3,750, which is also the pivot. A break below that level could push the price lower and eye $3,600. A daily RSI value of 44 is bearish-leaning, but the recent price gains checked alongside the Average Directional Index (ADX) at 37 shows that the buyers are taking control. Initial resistance will likely be at $3,980, beyond which it could test recent highs near $4,245.

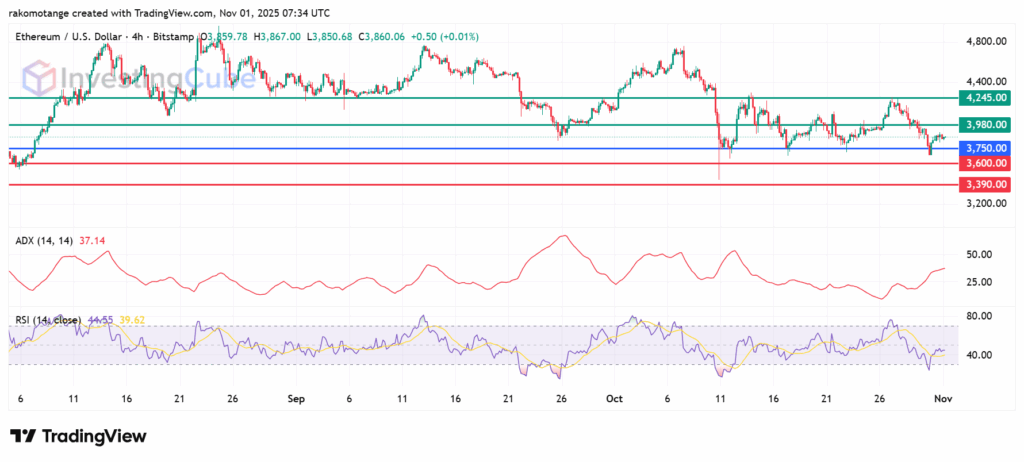
ETH/USD daily chart showing key support and resistance levels. Source: TradingView
Lower liquidity amplifies moves, and bulls can push higher with less resistance if support holds firm.
Yes, that’s a possibility based on the current market conditions. Low weekend volume often sparks squeezes, and current price defense at the neckline favors a bullish bounce.
The neckline is the lowest point of support between the two peaks of a double-top pattern. A price break below this level typically confirms the bearish reversal and project a further downward price target.