- Bitcoin Liquidity Heatmap aggregates data from multiple exchanges, weighing the leveraged long/short positions to assess the probability of liquidity.
- It shows how vulnerable Bitcoin is to liquidity at different times.
- It is not foolproof and should be used alongside other traditional analysis tools.
The cryptocurrency market, especially when it comes to Bitcoin (BTC) derivatives, is known for its high volatility the common practice of using leverage to increase potential gains (and losses). Because of this, special tools have come about to help traders predict big price changes. The BTC Liquidation Heatmap is one of the most well-known of the advanced tools created in this environment to predict significant price fluctuations.
What Is BTC Liquidation Heatmap?
The Bitcoin Liquidation Heatmap is a handy visual tool for traders that shows the concentration of possible liquidation orders at different price points. It shows price zones where leveraged positions could automatically close if the spot price of BTC moves against them.
Typically, the brighter the color on the map (like yellow or red), the more positions are at risk of being closed out at that price level. This means that millions of dollars could be wiped out if the price hits that point. On the other hand, darker colors (like blue) show areas where there are fewer positions at risk. By factoring in the leverage and entry price, platforms like CoinGlass or Glassnode can estimate the exact price point where a margin call would result in a liquidation.
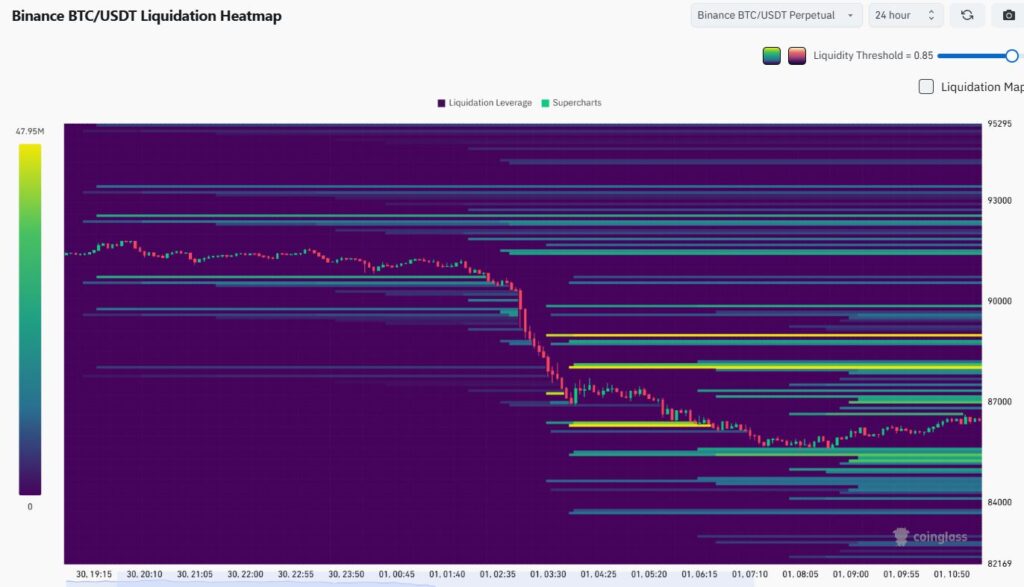
Binance Bitcoin Liquidation Heatmap on Coinglass on December 1, 2025.
How Traders Use BTC Liquidation Heatmap to Trade
Pro traders use these heatmaps to get a sense of what might happen in the future, not just to see what’s already happened. This helps them decide where to enter trades, where to set stops to limit losses, or how to make quick profits by scalping. For example, if the price of Bitcoin is falling and gets close to a zone around $90,000 where a lot of traders have long positions (bets that the price will go up), the liquidations that follow can make the sell-off even worse. But, once all those positions are closed out, the selling pressure often eases up, and the price might bounce back.
Glassnode’s insights dashboard pairs heatmaps with long/short bias metrics, revealing how skewed positioning amplifies risks. This is useful for confirming trends via open interest or funding rates.
Is the Liquidation Heatmap Reliable?
A liquidation heatmap is useful for understanding how vulnerable the market is and where liquidity is concentrated. It’s not a perfect predictor of price direction. Its value comes from showing where a big price move might get its fuel.
Reports comparing these on-chain liquidation clusters with realized market liquidations often show a meaningful correlation, suggesting the heatmap serves as a useful proxy for anticipating where broader market liquidations are likely to occur.
Key Limitations of Liquidation Heatmap
Even though it’s useful, the BTC liquidation heatmap isn’t perfect. BingX Academy points out that data accuracy is a concern. It shows relative intensities, not exact volumes, and manual closures often thin out predicted clusters before price arrives. BloFin echoes this, noting reliance on exchange-specific feeds can miss off-chain or spot adjustments. Sudden news such as Fed announcements or regulatory easing can override zones.
In Summary
In summary, BTC liquidation heatmap is a helpful tool for managing risk by highlighting potential volatility hotspots. You can use it to help decide where to place your stop-loss and take-profit orders, but always double-check its signals with other market analysis and on-chain data.
Bitcoin liquidation map is a visual tool showing price levels with the highest concentration of leveraged long/short positions that could trigger mass liquidations, displayed as color-coded heat zones
No. Bitcoin Liquidation heatmap is reliable for measuring market fragility and liquidity concentration, but it’s not a definitive prediction tool. It should be used as a complementary indicator alongside traditional technical analysis.
A major limitation is its incomplete exchange coverage. Some exchanges don’t share their info, so the map might not be 100% correct.