

- Bitcoin price has been on a steep slide since late 2025 and the outlook is still bearish-leaning with on-chain metrics and fundamentals showing weakness
- BTC's correlation with the Nasdaq has strengthened in recent days, deviating from being a "digital gold" to more of a "struggling tech stock"
- A return to $70k is a psychological boost but there's currently no decisive bullish momentum, leaving room for a potential deeper correction
Since mid-January 2026, Bitcoin’s price has been sliding, continuing a fall that started in October 2025. The BTCUSD pair is down about 20% so far this year, hitting a low of around $60,074 on February 60, the lowest since September 2024, according to CoinMarketCap historical data. As of this writing, it had bounced back a bit to register an intraday high of $71,383.
This article looks at how such trends often stem from a confluence of market forces, where initial enthusiasm gives way to realism.
On-Chain Reality vs. Sentiment
The dip lines up with bigger economic problems and issues specific to the crypto world. Data shows fewer institutions are putting money in, with about $5.7 billion pulled out of spot Bitcoin ETFs between November 2025 and January 2026.
Interestingly, while the price has stumbled, some on-chain metrics tell a different story. Coin Metrics recently observed that despite the price drop, the Lightning Network, Bitcoin’s scaling solution, grew by over 260% year-over-year. This suggests that while speculators are fleeing, actual network utility is quietly expanding.
However, the Crypto Fear & Greed Index doesn’t care much for utility. It recently dropped to 7 (Extreme Fear), a panic level not seen since the 2022 bear market. While many see this as a bad sign, some might see it as a buying opportunity. Historically, single-digit scores on the index have often meant that the selling is over, which could be a good time to buy for those who can handle the risk.
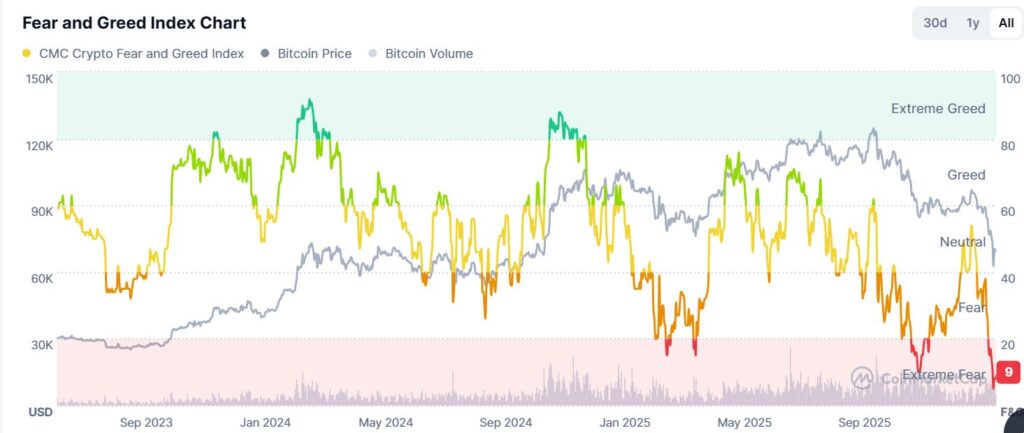
The Crypto Fear and Greed Index chart. Source: CoinMarketCap
The Reality Check Few Want to Face
While market consensus leans toward viewing this as a temporary correction amid long-term adoption, a contrarian view challenges this. Bitcoin has been showing persistent on-chain weakness that could signal a more prolonged reset, offering unique insight into potential undervaluation risks overlooked in optimistic narratives.
Glassnode data from February 4 showed that 11.1 million BTC are in profit, while 8.9 million are in loss. In the past, prices have hit bottom when these numbers get close to each other, which means the price could keep falling. Exchange reserves are at their lowest in years, between 2.4-2.8 million BTC, which reduces selling pressure for now but doesn’t change the overall negative view.

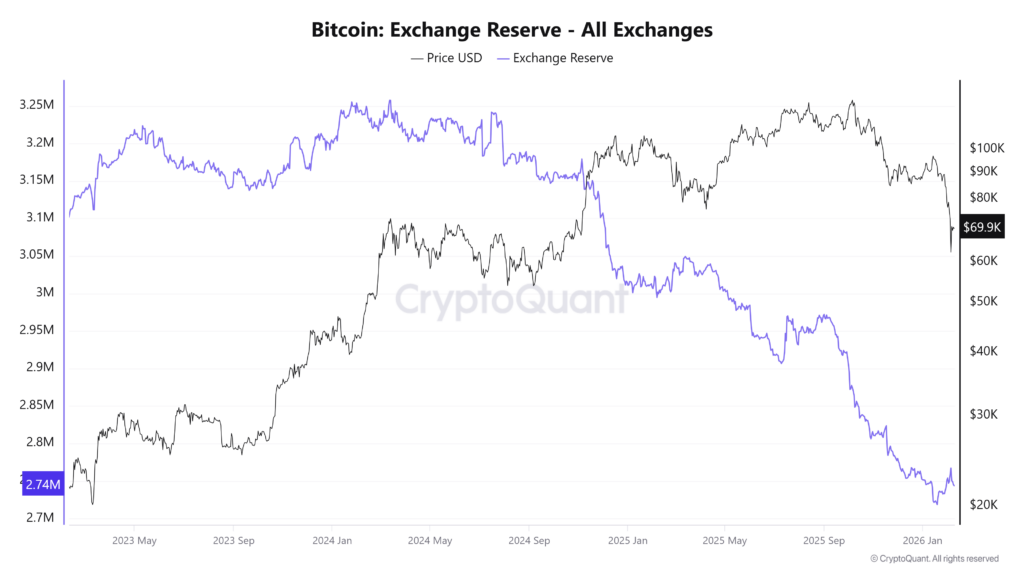
Bitcoin Price vs Exchange Reserves chart as of February 9, 2026. Source: CryptoQuant
Also, while Bitcoin is often called digital gold, it’s currently closely related to the Nasdaq, with a correlation of 0.75. Right now, it’s acting more like a risky tech stock than a safe asset like gold..
These metrics tell us Bitcoin may be nearing a bottom, yet challenge consensus rebound expectations by suggesting deeper capitulation is needed for sustainable recovery.
Bitcoin Price Forecast
After dropping below the psychological $80,000, the next support level is between $67,300 and $64,000. The RSI at 32 shows seller control, and if Bitcoin price goes below that level, the resulting momentum could trigger a deeper correction to test $60,000. On the upside, there’s primary resistance at the 10-day SMA at $72,530. A daily close above this is needed to reverse the current downtrend. If that mark become a support, the next barrier will likely be at $75,660.
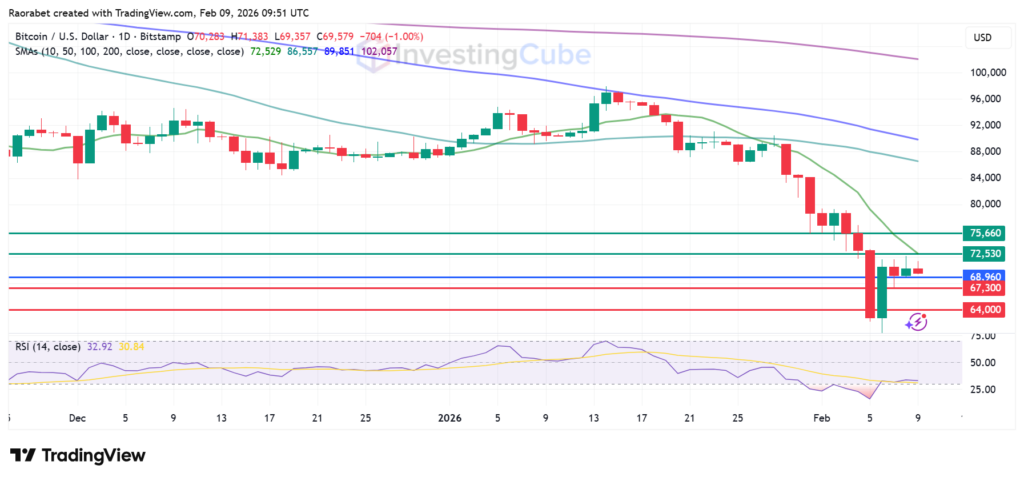
Tip for Traders: If you’re thinking about buying, consider setting a stop-loss at $58,800, just below the $60,000 level. Keep your position size small, around 1-2% of your total money, since there’s been $3.7 billion in liquidations recently, according to Coinglass.
With the reading denoting Extreme Fear, it signals oversold conditions for potential buys, but low readings challenge consensus recovery speed, implying prolonged fear if macro persists.
The outlook is mixed. Numbers suggest the price is near its low, but a lack of money coming in could mean a longer period of low prices.
Yes. On-chain data shows the Lightning Network’s capacity is growing rapidly, signaling strong Bitcoin utility despite the extended selling pressure.
