

- Discover how the latest US GDP data influences gold prices and its outlook, along with insights into the US Dollar's market reaction.
During the European session, gold starts the day rising to an all-time high. The rising bets on additional Fed rate cuts and geopolitical concerns boost the yellow metal. Gold faces a correction as an immediate reaction to the stronger US GDP data.
XAUUSD continuous contract advances by 0.35% or 15.10 points. Gold’s performance shows a 3.46% gain in the last five days and an 18.59% increase over the past three months.
This article explores the US GDP data release and its impact on gold prices, along with a technical outlook for XAUUSD and the US Dollar’s reaction to the released data.
The US GDP Data Release and Gold’s Reaction
The United States Gross Domestic Product expanded 4.3% for the 3rd quarter. The released data came above the forecast of 3.3% reported by the US Bureau of Economic Analysis. The previous quarter was 3.8% gorwth. This means that the US GDP expanded, indicating healthier economic conditions.
The report also includes the core personal consumption expenditures (PCE) price index. It rose by 2.9% QoQ, matching forecasts. For the same period, the GDP came in above forecasts, rising 3.7% compared to the expectations of 2.7%.
The US Bureau of Economic Analysis (BEA) explained that GDP data reflects several key factors, including:
- Decrease in investment.
- Consumer spending is rising
- An increase in exports and government spending.
- Third-quarter imports are less than those of previous quarters.
Gold’s Reaction and Technical Overview:
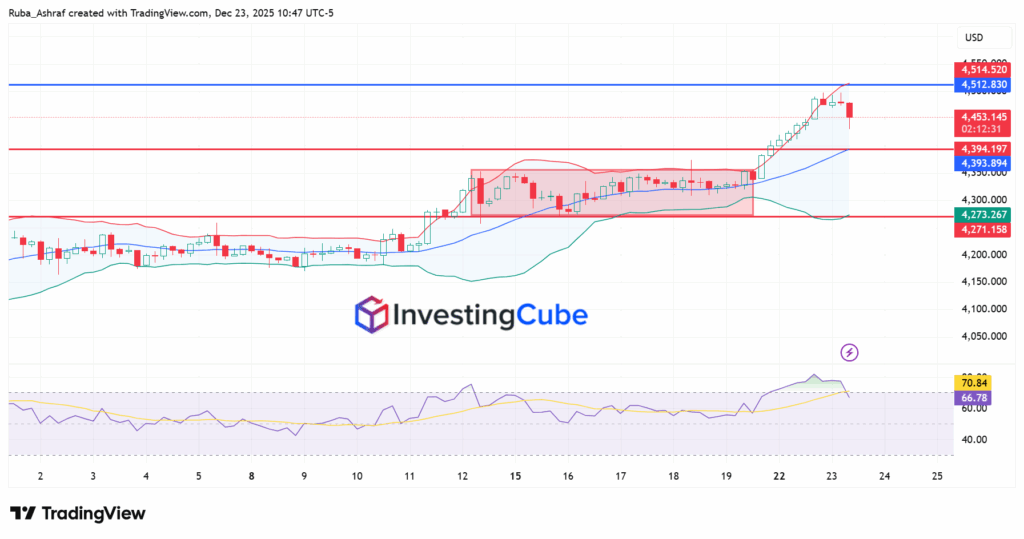
Before the release of the US GDP data, the gold price pushed toward the upper Bollinger Band, signaling bullish momentum. Gold price faced a resistence, which led to a pullback driven by the expanded US GDP.

The key resistance point is at the upper Bollinger band 4,512.83. The price reversed and is currently trading around 4,456.025. This correction can be considered as short-term profit-taking driven by the stronger US GDP.
Gold price remains above the middle Bollinger band, which keeps the bullish structure intact. From a momentum perspective, the RSI indicators above 70 indicate overbought conditions. It has since eased back toward the mid-60s. This pullback in RSI reflects cooling momentum, suggesting that gold may consolidate before attempting another upside move.
Overall, the trend remains bullish, but the market just reacts to the released data before continuing higher.
The US Dollar’s Reaction:
The US Dollar Index recovered from its lows in the previous trading sessions after the US GDP was released. At the time of press, the USD index was down 0.25% on the day at 98.00.
At the time of writing, the USD index is trading around 98.06. The index remains under pressure due to the stronger GDP. The stronger GDP means a higher potential for cutting interest rates by the Federal Reserve.
Among the geopolitical tensions and a stronger US GDP, investors will choose precious metals. The risk-averse sentiment will keep rising, boosting gold prices and weighing on the USD index.
Stronger US GDP may initially pressure gold by lifting the US Dollar, but over time, it can support gold if it leads markets to expect a more dovish Fed and lower real interest rates.
XAU/USD is sensitive to US economic data because it reflects shifts in the Dollar, yields, and risk sentiment.