
- Silver price has flashed a second successive day for the first time since November 2025
- The metal has just formed a bearish double-top pattern after failing to break the $80-$84 barrier
- The underlying market fundamentals are largely unshaken, meaning this could be temporary
Silver has hit a speed bump. After shooting up 138% in 2025, silver is facing a bit of a setback. Silver price traded at $ 75.63 at the time of writing, down by 3.25% on the daily chart, having closed with 3.78% in losses on Wednesday. This has people wondering if this is just a temporary pause as traders take profits, or if something bigger is going on.
Is this Profit Booking or Structural Shift?
Silver prices went from around $70 to almost $82 earlier this week but have since fallen. This is partly because of prices being rejected at important technical levels. Silver couldn’t break past resistance zones around $82-$83, which led to a pullback.
Furthermore, the CME Group recently raised margin requirements for silver futures. These margin increases often push traders to sell, which can drop prices quickly. Most analysts see this as a needed break. After silver almost hit record highs near $84 in late December, there were too many speculative positions in the market.
Is the Silver Market Overheated?
A market is considered “overheated” when price appreciation moves vertically without corresponding fundamental changes. In silver’s case, the Relative Strength Index (RSI) provides the clearest warning. Throughout late December, the RSI lingered above 70, the traditional threshold for “overbought” territory.
Looking deeper into 2026, silver’s path depends on the balance between industrial demand and monetary policy. Citigroup mentioned that about $6.8 billion in silver futures might be rebalanced, which could create more instability. There’s a double-top pattern forming above $80, and if confirmed, this could lead to a bigger drop, benefiting those betting against silver.
If silver can’t hold above $70, it could mean the speculative bubble is bursting Tensions between the US and Venezuela or a stronger dollar, as mentioned in Forbes’ dollar collapse warnings, could exacerbate pressure. The distinction hinges on upcoming data. Sustained industrial demand from sectors like solar and electronics, could limit downside.
Silver Price Prediction
Silver is pivoting at the 20-day SMA at $70.47 and the RSI at 59 still favours the buyers to be in control. That will likely see initial resistance established at the psychological $80.00. Breaking past that barrier could catalyse a stronger upside momentum to retest all-time highs of $84.00. However, only a solid weekly close above $82.50 would change the current correction and suggest a move toward $90.
Key support levels are at the psychological $70.00, below which the upside narrative will be invalid and a deeper correction towards the $66.37-$59.36 zone could be triggered.
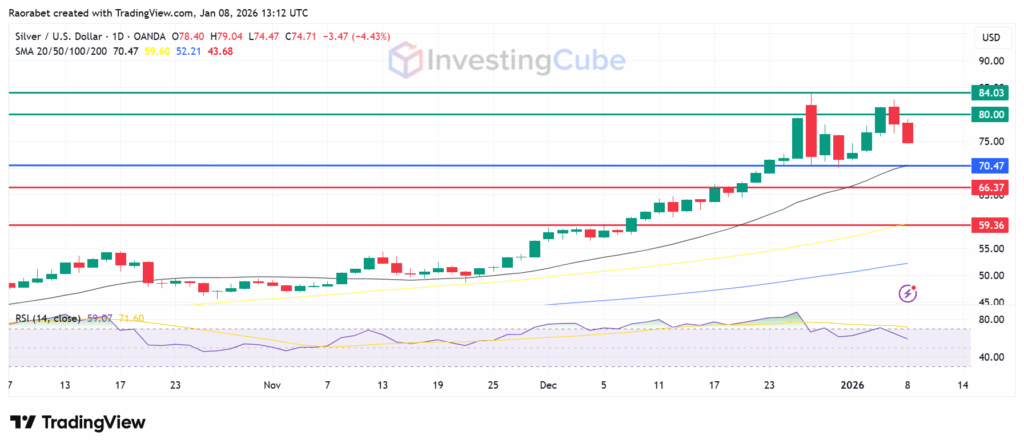
Silver price on a daily chart on January 8, 2026 with support and resistance levels created on TradingView
The primary drivers are profit-taking after a massive 138% gain in 2025, a strengthening U.S. Dollar, and a hike in margin requirements by the CME, which forced leveraged traders to sell.
Primarily profit booking in a correction phase, but a double-top above $80 could signal deeper pullback.
If silver breaches the psychological $70 support level and the 50-day moving average, it would suggest the beginning of a deeper bearish phase rather than just short-term profit-taking.