
- The US has triggered a potential trade war with Europe as its ambition to get Greenland rubs its key trading partners the wrong way
- Demand for solid state gold is showing signs of weakening as elevated prices keeps some traders away
- Central bank purchases of gold are expected to continue strongly in 2026
XAU/USD Update: Late January – Gold rises to new all-time highs above $5,000 as safe haven purchases spike.
Gold broke records this week, hitting over $5,000 an ounce. On January 26, 2026, it hit $5,090, a 2% jump for the day and a 17.6% rise since the start of the year. People are buying gold because they feel it’s a safe place to put their money, given current world events and worries about inflation.
Earlier, US President Donald Trump had walked back on his 10% tariff threat on eight European countries, including big economies like Germany, France, and the UK. This move cames after their disagreement with the U.S. government’s perceived aggression in its bid to acquire Greenland.
Bloomberg and Reuters reported a decline in stock futures, and investors rushed to find safe investments. Such is the setup that has sent Gold price (XAU/USD) soaring, reaching an all-time high of $4,690 per ounce on January 19, 2026.
Yet, Greenland isn’t the only factor. A mix of uncertainties is fueling the situation. In Washington, a sudden investigation into Federal Reserve Chair Jerome Powell has created doubts about the central bank’s independence. So, how could this turn out?
Gold Price Outlook Supported by Rising Trade Tariff Risk
As highlighted above, US President Trump sparked a fire in the markets after threatening tariffs against America’s top European trading partners. Germany, the United Kingdom, France, Netherlands, Sweden, Finland, Norway and Denmark could face an initial 10% tariff on their exports to the US starting February 1, 2025. That could rise to 25% by June, depending on how negotiations proceed.
As Denmark has already expressed its unwillingness to sell Greenland to the US, this could drag on for months. Furthermore, the US had not ruled out a forceful takeover either. This scenario creates a potentially highly volatile market that could increase gold’s attractiveness as a safe haven investment.
Meanwhile, investigations into the Federal Reserve’s spending and Chairman Jerome Powell’s impending retirement adds fuel to the fire of uncertainty in the coming weeks.
Market Movers Keep Gold in Focus Despite Thin Liquidity
Gold’s rise shows it’s still popular when things get shaky. If inflation sticks around, its price could go up even more. It looks like gold will keep going strong, especially with big investors interested. But, what the Federal Reserve does could slow things down.
Beyond the headlines, structural shifts are doing the heavy lifting. Central banks, especially in China and Poland, are buying less U.S. dollars and more gold, according to data from World Gold Council and Goldman Sachs. When big banks start stocking up on gold instead of cash, prices tend to increase. These factors have pumped up the propulsion on gold price.
Gold Technical Analysis: Bullish Structure Intact, RSI Signals Caution
From a technical perspective, gold’s broader trend remains bullish. XAU/USD continues to trade above its 100-day Exponential Moving Average, confirming that the longer-term structure is still intact.
However, momentum indicators suggest near-term caution. The 14-day Relative Strength Index remains above 70, signaling overbought conditions and increasing the likelihood of consolidation before the next directional move. Bollinger Bands remain wide, indicating that volatility expansion remains possible once liquidity improves.
Key Technical Levels to Watch
- Immediate resistance: Record high at $5,200
- Next upside target: Psychological level at $5, 500
- Initial support: Psychological level at $5,000
- Secondary support: January 9 breakout level at $4,900
- Broader support zone: $4,500.
A sustained break above $5,200 would likely confirm another leg higher, while a move below $5,000 could trigger a deeper but still corrective pullback.
Will Gold Stay Above $5,000 Per Ounce In 2026?
The consensus among the top analysts on Wall Street is a resounding “yes.” Citigroup’s analysts just raised their 90-day target to $5,000, which suggests we might see that price before spring. J.P. Morgan and Goldman Sachs are a bit more conservative but still optimistic. They predict an average of about $5,055 by the end of 2026.
The structural engine behind this is central bank demand. According to the World Gold Council, nearly 95% of central banks surveyed intend to increase their gold reserves this year.
Long-Term Gold Price Forecast: 2026, 2030 and 2040
Gold has entered 2026 with a strong momentum overflow from 2025, and the long-term outlook has shifted meaningfully as monetary policy, central bank demand, and global risk cycles evolve. Below is an updated, SEO-optimized long-term gold forecast built around the latest market trends, Fed expectations, and structural drivers shaping XAU/USD going forward.
Gold Price Outlook 2026: What Traders Should Expect Next
Looking ahead to 2026, the outlook remains constructive. A potential leadership shift at the Fed, Greenland-related US-Europe trade war, slower global growth, and persistent demand from China and emerging-market central banks all support a long-term bullish narrative. If the dollar weakens further and the easing cycle deepens, gold could extend its multi-year uptrend, with dips increasingly treated as opportunities for accumulation.
Even though $5,000 is a big deal, many think this is just the beginning. Metals Focus analysts say that even if some people sell to make a quick profit, gold prices are now set on a higher level. Bank of America forecasts that gold could hit $6,000 by spring 2026, because people are losing faith in regular investments. Goldman Sachs now predicts gold will end the year at $5,400, as more regular investors start buying in line with the central banks.
Risks to Gold Price in 2026: Is a Reversal Possible?
Of course, no rally goes up in a straight line. The biggest danger for gold right now is a drop in demand. At $4,690, jewelry buyers, who usually make up a large part of gold demand, are starting to pull back. Morgan Stanley analysts point out that if the U.S. and Europe quickly resolve the Greenland issue, the fear factor could disappear, leading to a quick price drop.
Also, a stronger U.S. dollar or lasting high interest rates, caused by rising inflation that could push the Fed to tighten policy, could make real yields rise and reduce gold’s attractiveness.
Key drivers for 2026:
- Fed policy transition: If the new Fed leadership leans dovish or signals tolerance for higher inflation, gold could retest or exceed the $4,300–$4,380 levels reached in 2025.
- Central bank accumulation: China, India, Turkey and other EM central banks continue diversifying away from the dollar, providing a long-term floor for XAU/USD.
- Geopolitical rotation: With tariff tensions, global elections and shifting alliances, safe-haven flows are likely to remain elevated.
- Real yields: Any sustained decline in US real yields historically triggers multi-month upside in gold.
2026 forecast range:
- Base case: $4,400–$4,750
- Bull case: A break above $5,000 if rate cuts accelerate and geopolitical risk heats up
- Bear case: $3,700–$3,950 only if inflation cools faster than expected and the dollar stages a major recovery
Overall, gold’s path into 2026 remains upward-biased, with dips likely to be viewed as accumulation opportunities.
Gold Price Forecast 2030: What Could XAU/USD Look Like by the End of the Decade?
Long-term gold forecasting is driven less by short-term economic data and more by structural trends that unfold over years: dollar cycles, global central-bank reserves, fiscal deficits, and commodity supply constraints.
Macro themes shaping gold into 2030:
- Persistent fiscal deficits in major economies increase long-term inflation risk.
- A structurally weaker US dollar would support higher gold prices over the decade.
- Central bank diversification away from USD assets is accelerating, especially across emerging markets.
- Slowing mine supply growth and rising extraction costs are tightening the physical market.
- Global uncertainty cycles, US elections, EU fragmentation, China’s long-term growth shift, historically fuel gold demand.
Based on these factors, updated for 2025 conditions, a realistic long-term view is:

2030 forecast range:
- Base case: $5,500–$6,000 per ounce
- Bull case: $7,000+ if the dollar enters a multi-year decline and EM reserve buying accelerates
- Bear case: $4,500–$4,800 if inflation collapses and real yields surge
Most likely scenario:
Gold steadily grinds higher, supported by structural deficits, geopolitical risk cycles and steady central bank buying.
Gold Price Forecast 2040: What Could XAU/USD Be Worth in the Next Global Cycle?
Forecasting gold 15 years ahead requires anchoring on mega-cycles rather than short-term events. These cycles include technological demand shifts, monetary trends, demographic changes and long-term economic realignments.
Factors shaping gold by 2040:
- Declining global trust in fiat currencies as governments run larger and more frequent deficits
- Peak-gold supply concerns, with mining output expected to plateau or decline
- Continued de-dollarization, especially if multi-currency settlement systems expand
- Higher global wealth, particularly in Asia, driving long-term physical demand
- Climate, energy and political instability cycles, which historically increase safe-haven demand
Gold 2040 forecast range:
- Base case: $8,500–$10,000 per ounce
- Bull case: $12,000–$15,000 if global monetary systems experience significant stress or persistent inflation
- Bear case: $6,000–$7,500 only if real yields remain structurally high and global stability improves materially
While long-dated forecasts carry uncertainty, the direction of travel is consistent: gold tends to outperform in periods of fiscal instability, geopolitical tension and monetary easing, all of which are likely themes over the next 15 years.
Gold Price History and Long-Term Trend Analysis (1970–2025)
Gold’s long-term trend from 1970 to 2025 shows a steady upward trajectory driven by inflation cycles, dollar weakness, and periods of global uncertainty. Major breakouts in 1980, 2011, 2020, and again in 2025 highlight how gold consistently gains value during economic stress and loose monetary policy. The multi-decade pattern remains intact, reinforcing gold’s role as a reliable long-term store of value.
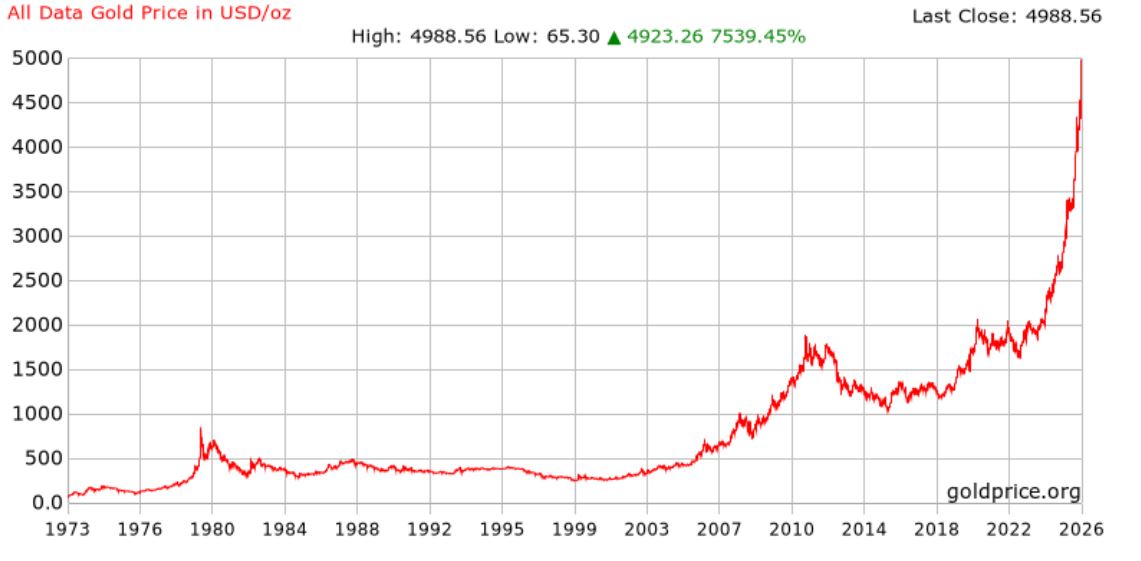
Gold Price Historical Chart
In August 2020, gold surged to a then-record high of $2,072.85 as the pandemic drove global investors into safe-haven assets. Although prices corrected afterward, the metal held above the $1,600 zone throughout 2021 and early 2022, supported by strong physical demand and persistent macro uncertainty.
Gold briefly dipped toward $1,616 in late September 2022 during the Federal Reserve’s most aggressive rate-hiking cycle in decades. But once inflation began moderating in 2023, XAU/USD entered a steady uptrend, breaking through $2,000 again in early 2024 and accelerating sharply into 2025. By mid-2025, gold had cleared multiple record highs, peaking above $3,700 after the Fed’s first rate cut, and remains elevated above $4,200 as 2025 closes.
Gold Rate In India Today
Gold prices in India continue to reflect strong global momentum, with 24-carat purity rates hovering near record highs. Demand remains robust ahead of the festive season and wedding-related purchases, fueling both retail buying and jewellery demand.
Meanwhile, the weak rupee, pressured by a softer US dollar internationally and firm domestic gold demand, adds an extra layer of strength to local gold rates. For investors and traders watching the gold market, the combination of surging global XAU/USD and favorable currency dynamics makes Indian bullion especially attractive right now.
I’ll keep posting my updated outlook on Gold and other assets in my free Telegram group, which you’re welcome to join.
How To Invest in Gold
One of the viable ways to invest in gold is by buying bullion. It may be in coins or bars, certified with purity and weight have. Then, one can purchase or sell the physical gold to a reputable dealer. However, security reasons often lead some investors to embrace the route of futures and options.
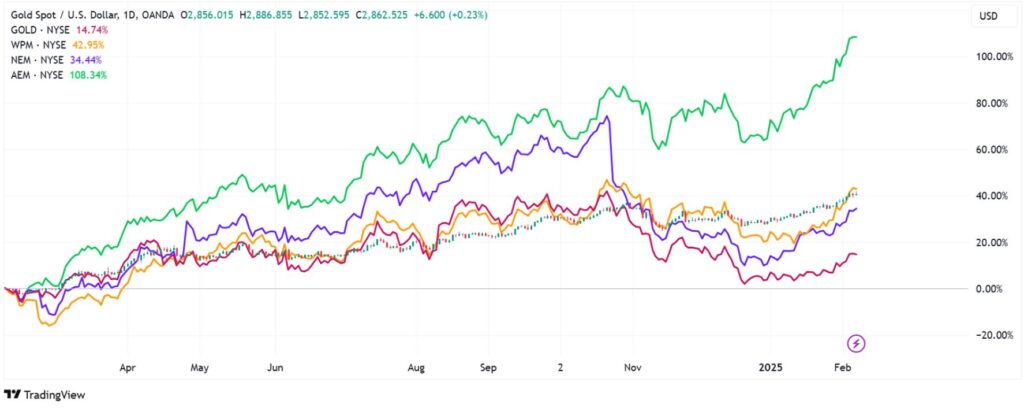
Best gold stocks to invest in
One of the best ways to invest in gold is through stocks. In the past few years, mergers and acquisitions in the sector has led to a significant consolidation in the sector. Today, only a few large companies dominate the industry.
Barrick Gold, a company valued at $30 billion, is one of the best gold stocks to invest in. Its stock has risen by 21% in the last year and is up by dropped by about 8.1% year-to-date. The other excellent stock to buy is Wheaton Precious Metals, which is worth over $28 billion. Unlike other gold companies, Wheaton does not do the real mining. Instead, the company has purchased rights for key gold assets.
The other best gold stocks to invest in are Newmont Corporation, and Agnico Eagle mine. The chart below shows the performance of some of the biggest gold stocks in the industry.
Gold Futures
Futures are contracts in which one agrees to buy or sell the financial asset at the agreed-upon price before the expiry of the contract. For options, the investor has a chance and not an obligation to buy or sell the underlying instrument for as long as the contract is valid. To invest in gold via futures and options, one needs an account with a reputable financial broker. It is possible to trade in gold for a commission through the brokerage account.
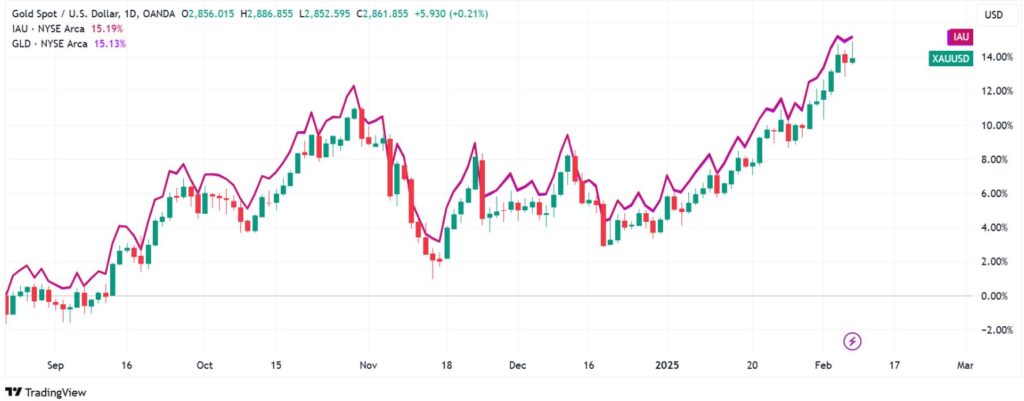
Gold ETFs
ETFs and mutual funds are yet another viable way to invest in gold. A share of this financial instrument represents a specific amount of gold. One needs a brokerage account to trade in gold ETFs or mutual funds, like in futures and options.
In addition to the aforementioned ways of investing in gold, an investor can consider buying stocks of gold mining companies like Barrick Gold Corp. (GOLD) or Newmont Corp. (NEM). While the share price is usually correlated to gold price, the firm’s fundamentals are also influential.
The chart below shows two of the most popular gold ETFs, the iShares Gold Trust and SPDR Gold Trust. As you can see, these ETF tend to move in sync with gold prices.
Gold Price FAQs
Gold is above $4,200 because rate-cut expectations, a weaker dollar, and firm safe-haven demand are supporting the rally. A break above $4,275 could open the path toward $4,300.
Gold’s trend is bullish, but buying on dips toward the $4,171–$4,180 support zone offers better risk–reward if volatility picks up around US data releases.
Most forecasts expect gold to climb further in 2026 as central banks continue buying, US rate cuts deepen, and global uncertainties persist.
Gold is rising today because traders are pricing in a December Fed rate cut, the US Dollar is softening, and safe-haven flows remain active ahead of key economic data.
This article was originally written in December 2024 and is regularly updated to reflect the latest gold market trends and price action