
- Gold prices hit new highs as geopolitics and renewed bets for further Fed easing take hold of the markets.
Gold price today touched off new record highs, as heightened expectations of further Fed easing and a weaker dollar sent the yellow metal into a blistering record-breaking run above $5500 an ounce. In early London/European trading, the gold price rose by more than 4% towards $5516. Gold has gained 27% in the first three weeks of January 2026, driven by a shift in investment flows away from risky assets and bonds toward precious metals.
The World Gold Council (WGC) says global demand for gold is expected to remain strong in 2026, as lower interest rates make bond yields unattractive and geopolitical risks drive safe-haven plays.
Live Chart
Gold price is now trading at $5526, having pulled back from a new record high of $5602. This gold price mark is significant, as most gold price forecasts for 2026, delivered late last year, used $5000 as a potential base case. With the new price surge, the markets have priced in a significant portion of the uncertainty premium and expectations of further Fed easing in 2026.
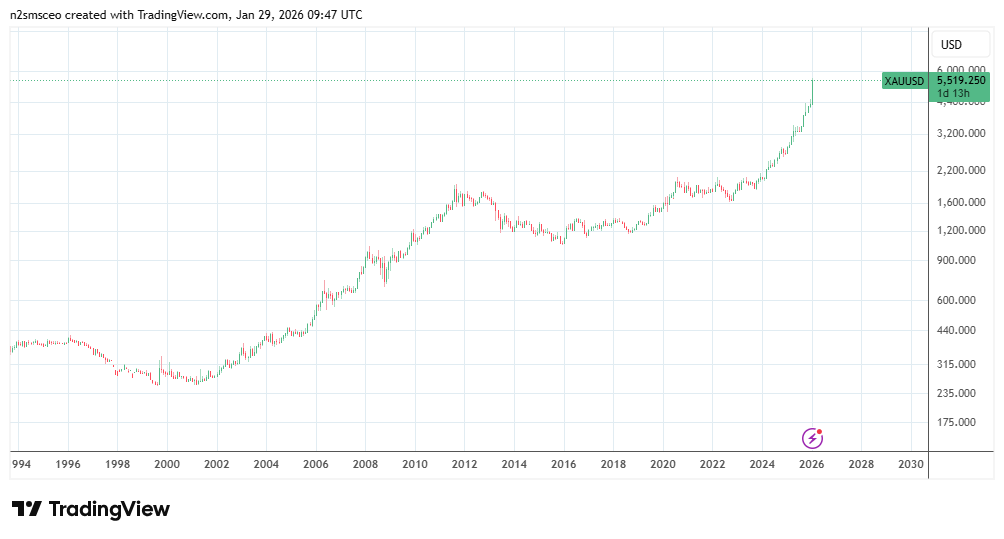
The monthly chart shows that the gold price is well in an uptrend. However, the spike’s sharpness could also be setting up gold prices for a sharp retracement before any new upticks.
Gold Price Forecast 2026: Macro Drivers
The top macro drivers for the gold price in 2026 include the following:
- Fed pathway and real yields
- Geopolitics
- Investment flows
- Physical demand dynamics (investment bids vs jewelry)
1. Fed pathway and real yields
The Fed rate pathway has been repriced since Fed Chair Jerome Powell hinted at further rate cuts in Q4 2025. The extent of the push into gold at the expense of a weaker dollar and lower real bond yields means that the market continues to reprice the Fed’s pathway bearishly. However, any re-acceleration of real yields or Fed commentary that walks back on the dovish pathway provides a bearish catalyst for gold prices.
2. Geopolitics and policy risk premium
The foreign policy thrust of the US government, as unraveled in 2025 (tariffs) and early 2026 (Venezuela, Middle East buildup, Greenland), has pushed a policy risk premium and an unstable geopolitical environment. Both of these have contributed to the flight to safety, which is part of the demand push sending prices to record levels.
3. Investment flows

The World Gold Council’s reported jump in gold investment demand in 2025 came largely via ETF inflows. Gold ETF flows will remain a potent macro driver of gold prices in 2026.
4. Physical demand dynamics
The WGC noted a sharp drop in jewelry demand in 2025 due to high prices. In 2026, gold price upside would have to be driven more by investment bids and official-sector demand than by traditional demand routes such as jewelry purchases.
Gold Price Forecast 2026: Institutional Price Targets
What are the institutional traders forecasting for gold prices in 2026?
Goldman Sachs is well known for its spot-on gold price calls over the last three years. The sell-side investment bank has raised its December 2026 gold price target from $4,900 to $5,400 per troy ounce.
Deutsche Bank is a German sell-side institutional entity. The bank forecasts gold prices to reach $ 6,000 per ounce in 2026. JP Morgan’s in-house research notes indicate a gold price forecast of $5000 in Q4 2026, with the potential to reach $6000 in the long term.
Base case: gold maintains the current range or extends higher, with a bias toward prices staying in the 5000-mid-5000s range. This scenario aligns with gradual Fed easing and a lack of acceleration in real yields.
Bull case: Sharp geopolitical shocks, persistent gold ETF inflows, official-sector buying by central banks, and US foreign policy risk premiums all add up to make a case for gold to push towards $6000, as forecast by Deutsche Bank.
Bear case: A rise in real US yield rates, US growth, or inflation surprises to the upside all make a case for gold to retrace. A compression of ETF inflows or outright reversal slows down gold purchases.
Gold Price: Technical Analysis
Price remains in a strong bullish trend (parabolic phase), following the early 2025 compression and breakout from the triangle, and the late-2025 bull pennant that led to another upside breakout.
The price is now in a pullback after hitting the 100% Fibonacci extension at 5594, as marked on the chart. The retracement now targets the 5131 mark, the site of the 61.8% Fibonacci extension and the previous intermediate resistance-turned-support. If this key pivot is degraded, a further decline towards the 4709 27% Fibonacci extension will be on the cards.
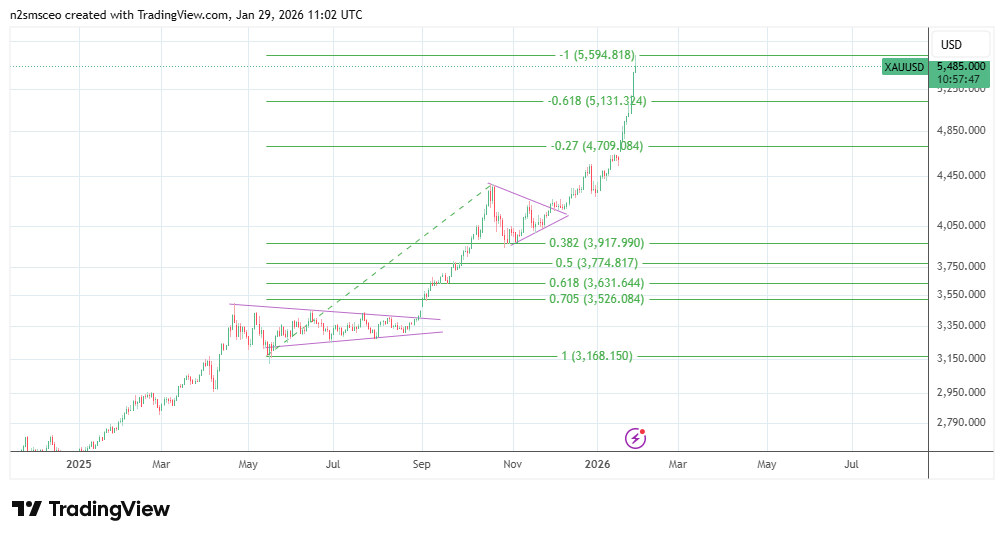
On the flip side, price needs to hold above the 5131 support to maintain focus on the 5594 resistance. If this barrier is breached, further upside targets at 6097 (141.4% Fibonacci extension) and 6344 (161.6% Fibo extension) become visible.
