

- Gold price faces a critical test around the $4,000 level in the light of hawkish Fed comments and uncertainty surrounding a government shutdown.
- Short-term bias is neutral-to-negative unless gold can re-capture the $4,112 level.
- Medium-term structure remains bullish, underpinned by strong central bank demand.
Gold enters November and a great deal of scrutiny following a strong October run-up that pushed price up by nearly 3.7%. However, the nearer momentum for the metal is clearly weakening with Hawkish comments from several officials of the Federal Reserve, a firmer U.S. dollar, and the continuing government shutdown in the US, combining to put pressure on sentiment.
With data unprecedentedly suspended like that of the Non-Farm Payrolls report, investors are forced to rely on private indicators like the ADP employment and ISM manufacturing PMI reports to gain a perspective of the health of the U.S. economy. In this light, gold hovers precariously around $4000 level — a “fate line” that could separate or decide whether gold resumes it’s upward call or plunges back into a deeper correction.
Fundamentals and Market Sentiment
The hawkish stance by several Federal Reserve policy makers last week included Cleveland Fed President Loretta Mester, Dallas Fed’s Lorie Logan, and Kansas City Fed’s Jeffery Schmid, absolutely nixes the potential for earlier red cuts. Federal Reserve Chairman Jerome Powell reiterated that thought, explaining that a December rate cut is “a long way from a done deal.” These comments diminished market optimism concerning a dovish pivot.
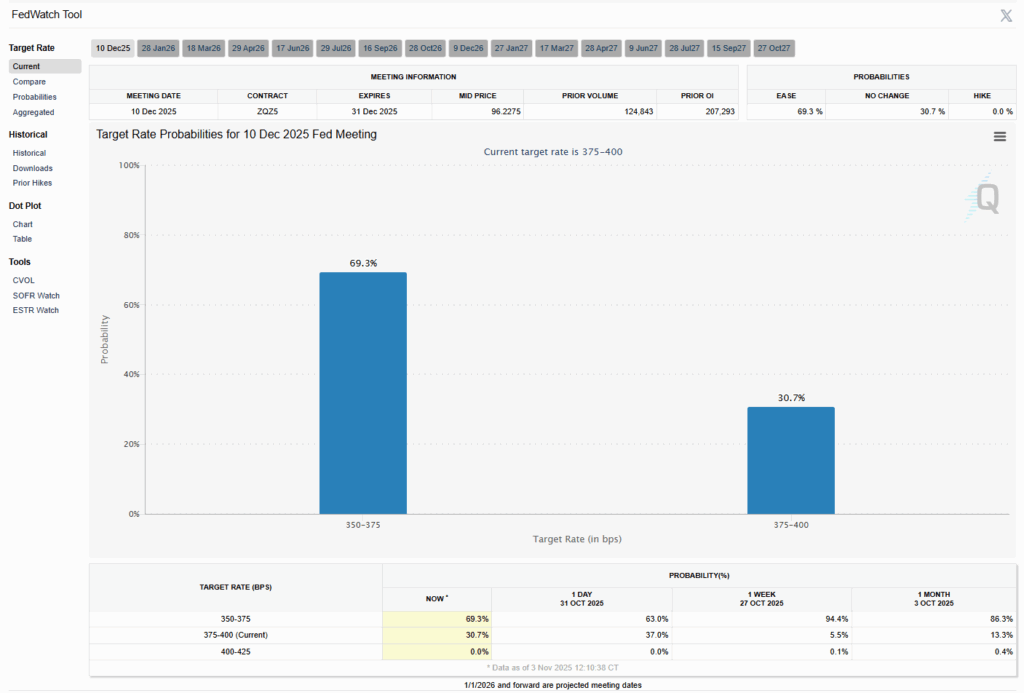
The rapid change in Outlook was reflected in the CME FedWatch Tool: The odds of December rate cut dropped from 93% to 63% over the course of a week. The adjustment strengthened the U.S. dollar index (DXY) to a three month high of 99.8, while 10-year treasury yields pushed back up to 4.08%. The strong dollar and higher yields undermine gold’s non-yielding appeal, forcing short-term liquidation by speculative traders.
In the meantime, the U.S. government shutdown has made data-dependent trading strategies impossible. With no official report (especially Non-Farm payrolls) traders become more opinion-based and uncertain, relying more heavily on private data sources.
Traders noted that if the coming data shows a great deal of weakness, traders may quickly revive expectations of rate cuts, resulting in a sudden rally in gold. If the private reads remain strong, though, the Fed’s Hawkish message will be reinforced, pushing gold back towards its lower support range.
Market sentiment continues to grow more polarized. In Kitko’s weekly survey found that 57% of institutional analysts think range bound trading will persist, while only 21% think higher prices are coming. Retail sentiment, on the other hand, is high, with 64% of respondents still betting on new highs. Such differences between professional caution, and retail exuberance often precede volatile price moves.
The short-term headwinds notwithstanding, structural support for gold remains. Morgan Stanley believes that long-term permanent price support for gold remains intact, reaffirming its long-term bullish attitudes with an average price of $4,300 by 2026, on the basis of continued diversification away from the U.S. dollar.
RJO Futures believes that “currency debasement and central bank buying remain intact,” and that the current pullback represents a healthy correction. On the other hand, FxPro thinks the strong dollar in combination with resolving geopolitical pressures could result in gold remaining in the consolidation phase in the medium-term outlook.

Technical Structure
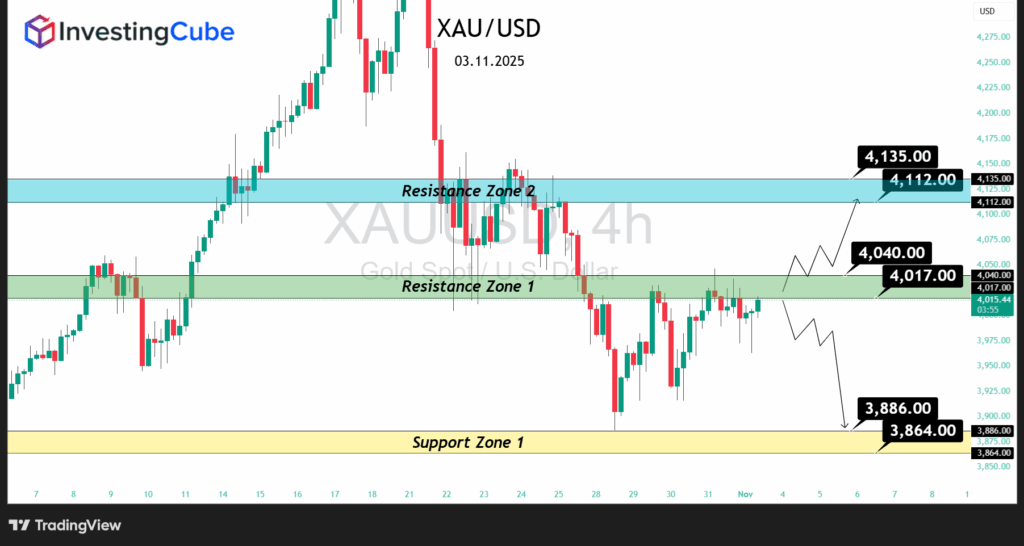
From a technical standpoint, gold is in the process of testing an important level of resistance.
- Resistance Zone 1 – $4,017 – $4,040 – the near-term ceiling for short term bulls.
- Resistance Zone 2 – $4,112 – $4,153 – above which a breakout would confirm a bullish continuation to $4,200 – $4,265.
- Support Zone – $3,864 – $3,886 – this is the point of origin for the rebound in October and a significant area of demand. A decisive break down here could set up further downside to $3,830 – 3,800.
At this point in time, gold is trading at about $4,009 – 4,019, just below the first resistance area. A successful breakout above the and a sustained close above $4,040 would likely attract momentum buyers looking for the upper resistance areas. Conversely, a failure to hold $4,000 could indicate a return to a bearish control state which could lead to further liquidation.
Outlook and Gold Price Forecast
Near-term directional cues for gold will be driven by this week’s private U.S. data. Should the ADP employment or ISM manufacturing PMI numbers be weaker than expected, the market may see a reassessment of Fed easing expectations, leading to a corrective rally back towards $4,112 or more. Conversely, better than expected data will embolden the Fed rhetoric, with renewed selling pressure possibly leading to a retest of the $3,886-3,864.
Medium-term fundamentals continue to favor a high gold price dynamic as central bank purchases, dollar debasement pressure and persistent risk of inflation should point to higher prices. Traders are advised to temper their expectations,
However, as the market is transitioning from an explosive rally to a period of consolidation. In this context, the better risk report is likely to be found buying any dips around $3,889-$3,864 levels rather than in chasing the breakouts above $4,134.
Frequently Asked Questions
Because technical exhaustion, signals from a hawkish Fed and a stronger dollar are causing temporary demand by central banks and investors to be overridden.
The $4000 psychological level. A decisive break below mean a deeper correction towards $3,886-$3,864.
Weaker-than-expected U.S. data numbers, reviving global geopolitical situations or surprising dovish pivot from the Fed could prompt an upward move.