
In the last month, Bitcoin prices have experienced a remarkable surge, driven by institutional demand and interest.
BTCUSD hit an all-time high above $40,000 last week, fuelling talk from several quarters of Bitcoin prices entering the 6-digit realm.
We have seen this all before. Before the 2017 crash, the internet was rife with all sorts of speculative predictions, of the type that has resurfaced everywhere. However, today’s 15% correction has led many to wonder: is the Bitcoin bull run over?
Those who are well versed in trading knew that the market was overdue for a correction, given the steepness of the surge. The Dow Theory lets us know that market prices are all about ebbs and flows. We have had a good flow to the upside for some time; it is now time for the ebbs, and the correction of the last three days shows this clearly.
The bull run is not over. Things are different this time around. The surge is being driven by institutional money, and there is a lower number of BTC to mine. Rewards have also undergone a halving event. The fundamentals appear to have changed, and what we have seen could be the first of several cycles of surges and corrections in Bitcoin price.
BTCUSD currently trades 10.52% lower on the day.
Technical Levels to Watch
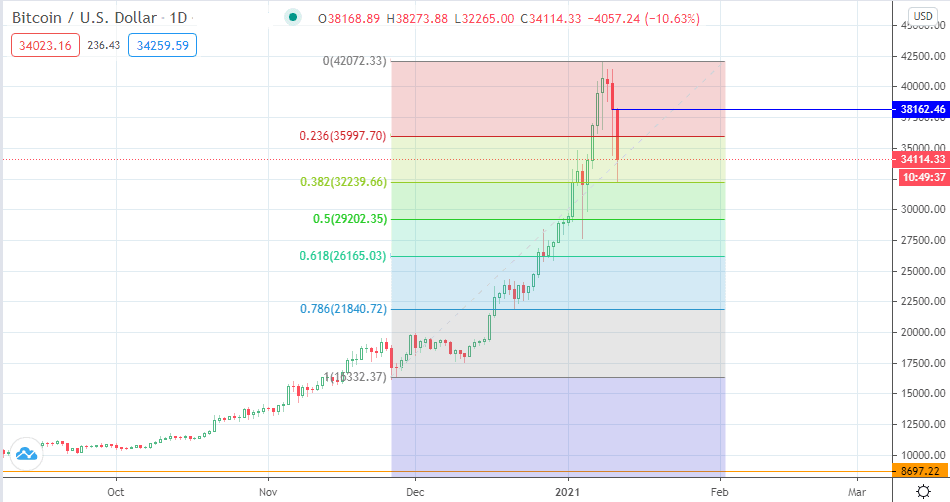
A Fibonacci retracement trace from the 26 November swing low at 16332 to the all-time high at 42072.33 shows that the intraday low to which Bitcoin prices slumped, touched off the 38.2% Fibonacci retracement level at 32239.66. Prices have bounced from there, which puts the initial upside target at the 23.6% Fibonacci retracement level (35997.70). The level to beat for buyers remain today’s high at 38162.46, as well as the ATH.
On the other hand, a drop below 32239.66 opens the door towards 29202.35 (50% Fibonacci retracement), and 26165.03. Any of the retracement levels may be deemed cheap buy points for bulls, and resurgent demand at these levels reignites the move towards the upside.
Don’t miss a beat! Follow us on Telegram and Twitter.
BTCUSD Daily Chart
More content
- Download our latest quarterly market outlook for our longer-term trade ideas.
- Follow Eno on Twitter.
- Do you enjoy reading our updates? Become a member today and access all restricted content. It is free to join.