

- Traders depend on support and resistance levels to make critical decisions in the market. We discus how resistance works in crypto market.
Cryptocurrencies have grown in popularity over the last few years. As more traders enter the crypto trading space, one of the most often asked topics is whether traditional trading techniques apply to crypto trading. In this case, crypto traders ask if the support and resistance idea can be used to better assess cryptocurrency prices.
Support and resistance are price points (areas in graphs) on trading charts that see a lot of buying and selling activity. A price level at which an asset’s price stops dropping is referred to as support, whereas resistance is the point at which the price of an asset ceases to rise.
The concept of support and resistance predicts that prices will halt at these levels or zones in the future and that they will serve as a recalled psychological barrier for pricing. Furthermore, once certain levels are breached, they switch functions (initial resistance becomes support and vice versa), illustrating the importance of polarity. It can be challenging to locate these critical levels.
Support zones emerge around prior price lows, while resistance zones form around previous price highs. Once a price level of support or resistance has been found, it can be used as a potential entry or exit point. Whether you choose to buy Litecoin or sell Bitcoin, these indicators serve to aid all cryptocurrency trading examples. Here are some ways to assess and identify these trigger points.
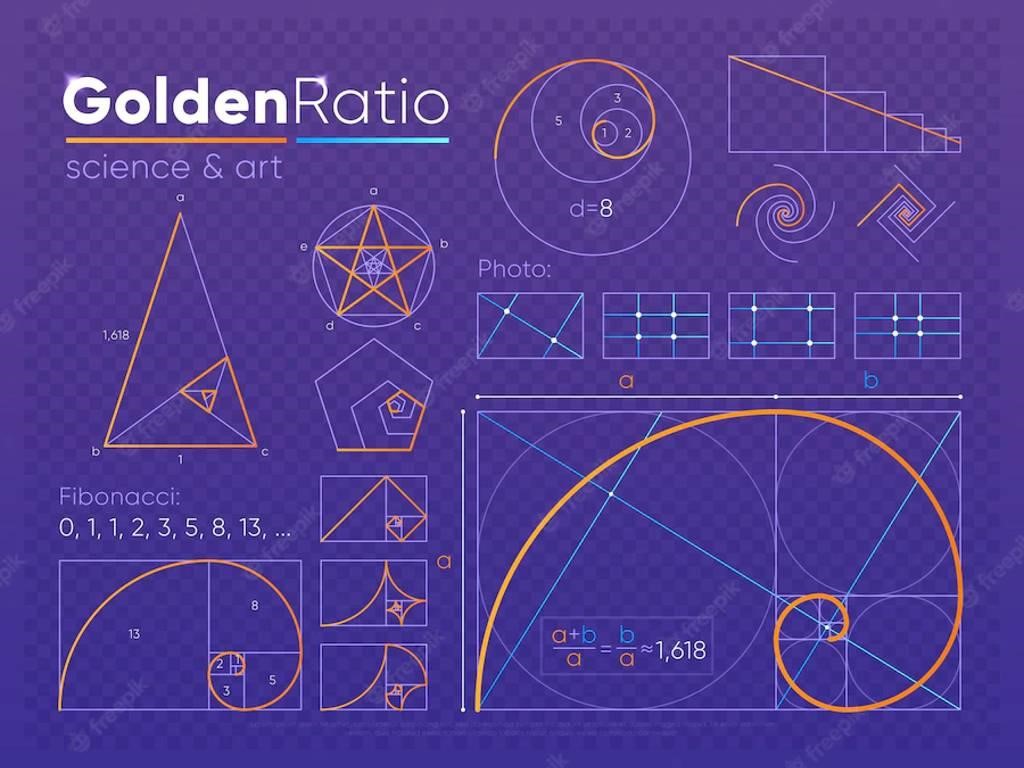
1. Fibonacci
The Fibonacci sequence is our list’s first support and resistance indicator. Fibonacci is a set of numbers that when added together yield a specific number, such as 0, 1, 1, 2, 3, 5, 8, 13, 21, 34, 55, 89, 144, and so on. These figures are extensively used to establish objectives and entry points when trading equities, commodities, and, especially, cryptocurrencies during market trends. Remember that Fibonacci is only used in trending markets and should be drawn from left to right. Fibonacci retracement numbers are used during trending markets to define targets and entry locations. In addition, they indicate reversal places where traders may discover entry possibilities during trend retracements.

2. Peaks and troughs
To create your lines using peaks and troughs, select your timeframe and locate the highest peak on the chart and the lowest point. Then make a note of each peak and dip. If there is a downtrend, the lower-low height serves as the support level, and the lower-high peak serves as the resistance level. In the case of an upward trend, the support level is the higher-low peak, and the resistance level is the higher-high peak.
3. Moving averages
Traders will use moving averages of varying lengths to highlight support and resistance levels. Moving averages below the price constitute levels of support, while moving averages above the price form resistance levels. Traders can visualize initial and deeper support and resistance levels by combining multiple-length moving averages. Generally, the shorter the moving average, the weaker the support or resistance it creates. Moving averages will highlight locations where the price may move through or bounce off as it advances to areas that a trader believes are support or resistance. If the price moves to the moving average without bouncing, it is likely to move to lower levels of support.
4. Pivot points
Chartists can use pivot points to establish intraday support and resistance levels. Pivot points calculate a pivot point for the current day based on the previous day’s open, high, and low. Three resistance and support levels are calculated and presented above and below the pivot point using this as the base. Pivot point support and resistance levels can be similarly applied to regular support and resistance levels. Like all indicators, pivot point signals must be confirmed using other technical analysis components.
5. Round numbers
Round numbers are commonly used as support and resistance since prices find it difficult to move past them. They are also known as psychological support and resistance zones because they don’t always correspond with any technical pattern on the chart—they are in our heads. Many of us prefer to pay round prices when we shop. This option causes us to place orders in rounds. More orders at these points generate pricing barriers.

Conclusion
This post seeks to give traders a head start in developing a solid trading strategy based on the elements of support and resistance, whether they choose to buy Litecoin or any other cryptocurrency. When properly implemented, they are trustworthy factors that can break all money-making ceilings in the cryptocurrency market.