- The XinFin Network price prediction is for the XDC/USDT pair to hit new lows as it seeks a bottom following a relentless selloff.
Despite positive developments within the network’s ecosystem, the XinFin Network price prediction continues to tilt towards the bearish end of the stick. This is as the XDC/USDT pair posts a 2.33% loss on the day, marking it three straight days of losses.
The XinFin Network’s entry into the NFT space occurred earlier this month when the project launched its NFT marketplace known as XDCNFT. The project is also delving into the motorsports arena to deliver its suite of non-fungible tokens that will feature prominently in the marketplace.
XinFin is also sponsoring an online global hackathon which started on Wednesday, 25 May. The hackathon comes with prizes of $50,000 to those who design dApps for the XDC Network’s blockchain. The prizes will be paid in the XDC crypto.
However, the crypto market’s lack of bullish sentiment is the predominant market trigger. XinFin price predictions and those of other cryptos are currently non-responsive to fundamental triggers inherent within each network.

Technically speaking, the intraday decline forms a component of the expected bearish continuation move that followed the breakdown of the descending triangle on 23 May. The daily candle of 23 May failed to achieve the required percentage closing penetration below the triangle’s border to achieve the price filter confirmation.
The closure of the next candle of 24 May below this border provided the time filter confirmation for this move, resulting in three straight days of the move to the south. The XinFin Network price prediction favours continuing this move to its completion point at the low of the 12 May candle, which saw a strong rejection on the said date.
XinFin Network Price Prediction
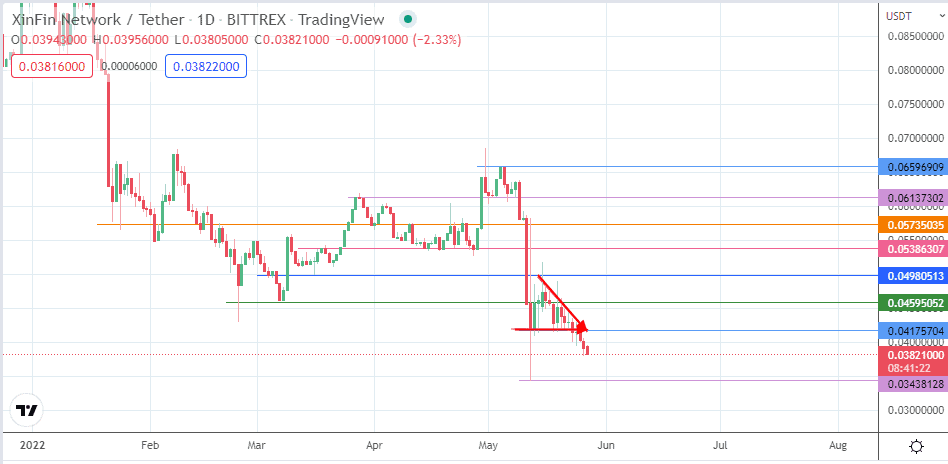
The breakdown of the descending triangle on the daily chart of the XDC/USDT pair is expected to hit completion at the 0.03438128 price mark. This is the site of a previous low of 12 May 2022. As it is, there are no obstacles to the bears attaining this price point. If this support gives way to additional bearish pressure, Fibonacci extension levels could present new support levels at 0.03367406 (100% extension) or at the 127.2% Fibonacci extension point found at 0.02935171.
On the flip side, the bulls need to protect the support at the 0.03438128 price level to give a fighting chance at attaining the resistance at 0.04147243. This is where the lower border of the broken triangle comes in, acting in role reversal as new resistance. Above this level, a further advance has available targets at 0.04595052 (8 March 2022 low) and at the 0.04980513 price point (5 March and 16 March lows). An additional target to the north lies at the 0.05386307 price mark, where the 18 March high is located.
XDC/USDT: Daily Chart