USD/INR exchange rate is having a pullback after briefly surging to its highest level since May earlier this month. The Indian Rupee is gaining strength due to a weakness in the US dollar. The technical analysis reveals that the pair may drop more before a potential recovery.
On Wednesday, USDINR slid once again and was trading 12% below yesterday’s closing. This translates into the fourth consecutive red day for the pair. The US Dollar to Indian Rupee exchange rate has shown very little volatility this year amid a volatile DXY Index.
RBI’s Interventions Kill Volatility In Indian Rupee
The Reserve Bank of India (RBI) is keeping the Indian Rupee stable by intervening as required. Consequently, the volatility in the USDINR pair has decreased a lot. The low volatility is keeping the short-term traders at bay. As per some analysts, RBI is keeping USD/INR stable to make it suitable for international trade.
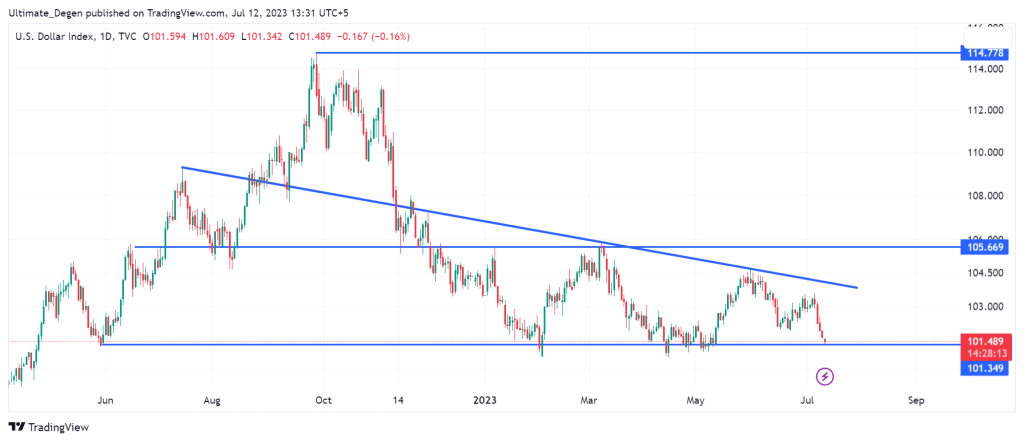
The following chart of the DXY Index shows that the dollar strength index has been in a tailspin since last week. The index currently stands at its lowest level in 2 months. However, there is strong support around 101 regions which suggests a short-term bounce in the US dollar is likely.
USD/INR Forecast July 2023
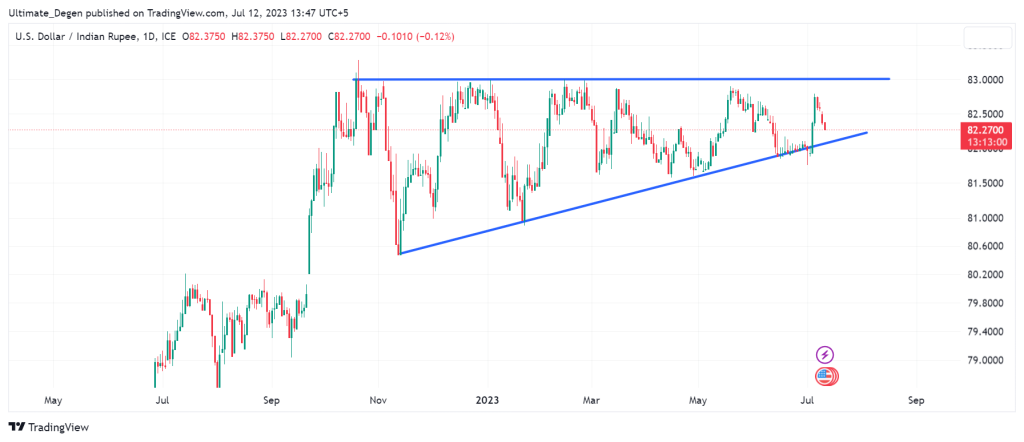
Technical analysis of the following USDINR chart depicts the formation of ascending triangle pattern. This pattern has been repeatedly mentioned in my previous forecasts. The top of this pattern is acting as a strong resistance level which has resulted in multiple rejections.
It is very difficult to make a USD/INR forecast due to RBI’s interventions. As soon as the pair breaks above or below the triangle pattern, I expect the volatility to increase. However, that seems unlikely to happen any time soon. In the coming days, the pair may retest the bottom of this wedge which lies at 82.10.
In the meantime, I’ll keep sharing the updated USDINR forecast and my personal trades on Twitter, where you are welcome to follow me.