The Graph price (GRT-USD) is surging once again after a massive pullback. GRT coin is retesting a key resistance, and a reclaim can send the price much higher. After a brutal week with negative price action, crypto markets have turned green once again this week.
On Tuesday, The Graph crypto is having a very bullish day. At press time, it is trading at 0.1563 after gaining 7.7% since yesterday. GRT coin has shown a remarkable recovery from its last week’s lows of $0.105 and has already pumped by 47% in the last three days. This puts it among the best-performing cryptocurrencies this week.
GRT Coin Rebounds Amid Lowering Inflation
The US CPI data for February has just been released, and it showed a decrease in YoY inflation. The report came according to expectations as the YoY inflation decreased from 6.4% to 6%. There was also a slight decrease in Core inflation on a YoY basis, as it fell from 5.6% to 5.5%. This news has given much more momentum to The Graph price, which is already up 47% in 3 days.
The markets are taking the signs of decreasing inflation as bullish expecting that the Fed might adopt a dovish tone in the upcoming FOMC. The FOMC meeting will be held on 22nd March, where the members will decide on the interest rate hike. After today’s CPI data, analysts are still expecting a 25 basis points hike in this month’s meeting.
The Graph Price Retests Key Resistance
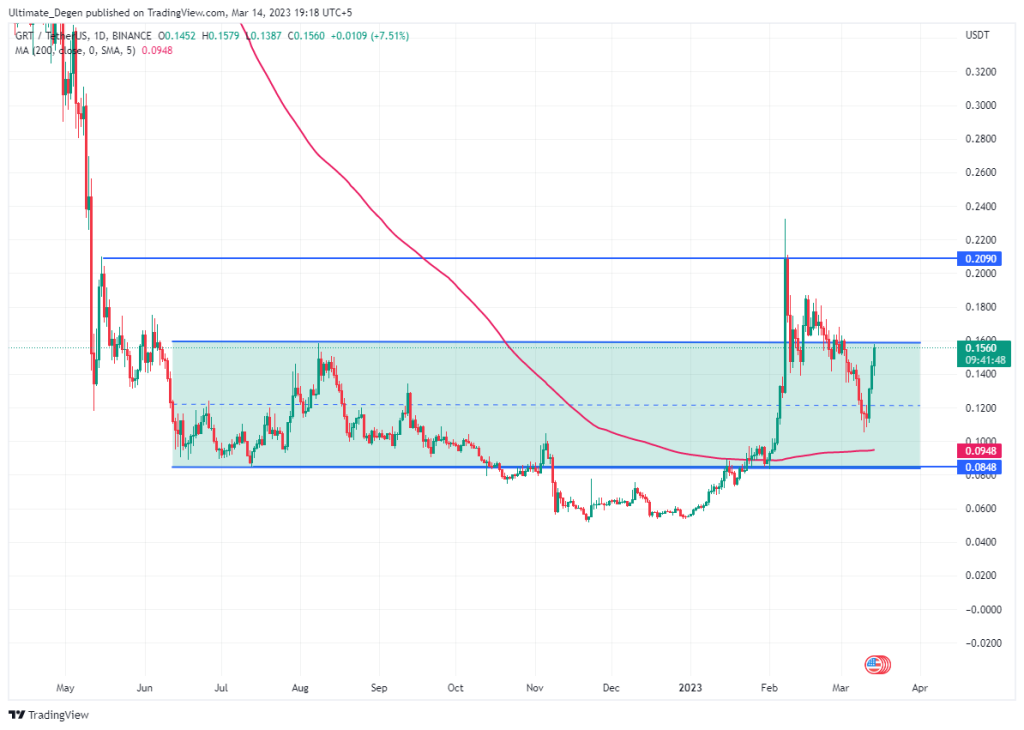
As evident from the following chart, the GRT coin has been in a downtrend since last month. This downtrend also corresponds to the major correction in BTC price. As Bitcoin has surged to its new yearly highs and is trading at $25,800, The Graph price prediction has also flipped bullish once again.
On the daily chart, GRT/USD is still maintaining the uptrend that started with the new year. The price has marked a higher low as it dropped to $0.105 during the weekend. At the moment, the price is retesting the key resistance of $0.158, which is also the August 2022 high. I expect a pullback from this level in the next few days. A reclaim of this level can propel the price above the $0.20 level.