The bears of the US stock market have been caught off guard due to a recent surprise trend reversal in the S&P 500 index. According to the latest stats, the US hedge funds have lost more than $40 billion betting against the benchmark index.
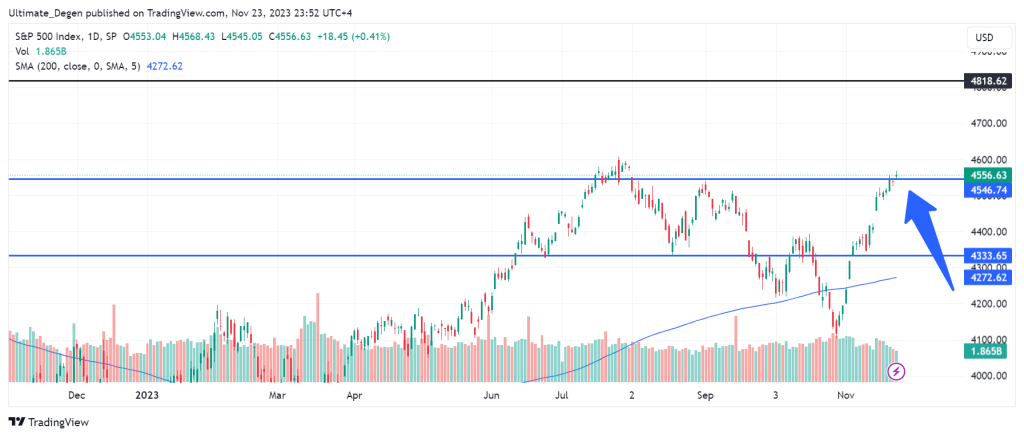
The SPX chart shows a V-shaped recovery since the start of November 2023. This rally seems to be fuelled by multiple headwinds, like the slowdown in inflation and the falling strength of the greenback.
However, the biggest benchmark of the US equities is still lagging behind the tech-heavy NASDAQ 100 index, which has already tapped new yearly highs this month.
It is evident from the following chart that the S&P 500 index forecast depends on the bulls’ ability to gain strength above the 4,545 level. This level which is marked on the chart below, is going to be the most critical level for the rest of this year.
If the index flips this level into support, a surge to a new all-time high might become a reality.