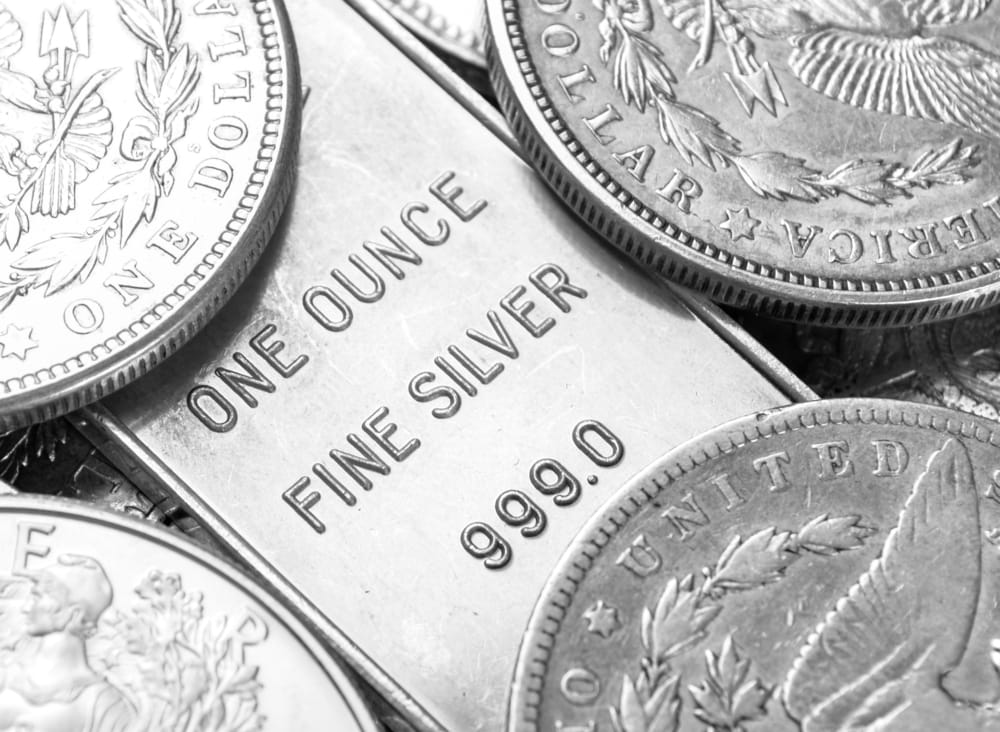
Silver price has soared in the past few days as investors rush to precious metals after the decision by the Federal Reserve to initiate an open-ended quantitative easing program. In the past five days, the price of palladium, platinum, gold, and silver has risen by 39%, 16%, 8%, and 19% as shown below.

Silver, often known as gold’s poorer cousin, is known to react mostly to the news from the Federal Reserve. This is because silver tends to follow the action in the gold market.
In the past few days, we have heard reports that people and investors are rushing to gold to shield themselves from a potential crash of the dollar. As the supplies of gold are running out, the next viable option to most investors has been silver.
However, in reality, silver is very different from gold. For one, gold does not have a major industrial use. Most of the yellow metal that is mined is bought by investors and central banks. Silver, on the other hand, is mostly bought by companies manufacturing kitchen, household goods, and jewellery.
There has been another trend in the silver market. A closely figure known as the gold and silver ratio has recently spiked to its highest level in history. The ratio has recently jumped to almost 100, which is significantly higher than its average of below 50.
In the short term, the price of silver will be determined partly by what gold does and demand from investors. Indeed, recent data shows that inflows in silver ETFs is at the highest level in recent history.
Read our Best Trading Ideas for 2020.
Silver Price (XAGUSD) Technical Analysis
In the four-hour chart below, I have drawn a Fibonacci Retracement line by connecting the YTD low and the YTD high. As you can see, the price is trading at the 38.2% Fibonacci Retracement level. I have also added the Ichimoku Kinko Hyo, which I find being interesting. The price is attempting to emerge from the Ichimoku cloud. Meanwhile, and most importantly, the Leading Span A (green) is just crossing over with the Leading Span B (red). This is said to be a bullish sign. Therefore, I expect the pair to completely emerge from the cloud, and test the 50% Fibonacci Retracement level at 15.35. This will be a 7% gain from the current price.
Don’t miss a beat! Follow us on Telegram and Twitter.
More content
- Download our latest quarterly market outlook for our longer-term trade ideas.
- Follow Crispus on Twitter.
- Do you enjoy reading our updates? Become a member today and access all restricted content. It is free to join.

