
- The Nvidia share price forecasts for the week will rely more on the AI driven headlines and risk-on/risk-off sentiment.
Nvidia Share Price: Live Chart and Current Setup
The Nvidia share price forecasts are now dominated by AI leadership metrics rather than valuation. The stock closed at $181.3 on 17 March. The AI capex/inference narrative continues to play a role in the macro drive for the stock, even as rate expectations and risk appetite also dominate the macro backdrop.
What is Driving Nvidia Share Price Forecasts Right Now?
1. GTC 2026 Roadmap
At the GTC 2026 conference, Nvidia CEO Jensen Huang presented AI as a $1 trillion revenue opportunity through 2027 and also provided updates on the roadmap for releasing the Vera Rubin, Vera, and Feynman CPU architectures. This is forcing markets to reframe Nvidia’s pricing not just as a training-GPU stock, but as a broader AI infrastructure company. This will have implications for the company’s future valuation.
2. Earnings Breadth
NVIDIA’s Q4 2026 results were stellar: $68.1 billion in revenue, adjusted earnings of $1.62 per share, and Q1 sales guidance of $78 billion were the highlights of the earnings call that smashed investors’ expectations. However, questions about the sustainability of these earnings and the growing erosion of Nvidia’s market dominance by competitors led to a selloff. Nvidia’s ability to sustain these earnings and fend off competition remains a key factor in its share price forecasts for 2026.
3. Policy/China constraints
The US government’s restrictive policy on AI component exports to China remains a major headwind for Nvidia, given its relatively large China exposure. NVIDIA’s ability to redirect demand and shift capacity in response to the US policy will be a major factor in determining its share price forecasts going forward.
Nvidia Share Price Forecasts for the Week: Key Catalysts
What are the near-term Nvidia share price catalysts?

1. Rates/risk sentiment: Nvidia mimics a mega-cap stock and responds to risk sentiment. A rise in bond yields or a return of risk-off market conditions will cause a stock with even the strongest of fundamentals to suffer from earnings compression.
2. GTC follow-through: Investor conviction will improve when tangible customer traction or partnerships are supporting the roadmap.
3. Competition: With new hyperscalers that offer in-house chips and expanded inference and training now entering the market, the market’s continued preference for Nvidia’s products faces a threat.
Nvidia Share Price Forecasts: Weekly Scenarios
Base case: the price remains headline-driven, with choppy performance that illustrates the two-way trade the stock is expected to display. The tone remains mildly constructive, with the $1 trillion inference opportunity quoted from Huang’s GTC 2026 presentation continuing to support the stock. However, rallies may fade quickly due to valuation concerns and headlines from competitors.
Bull case: a continuation of the breakout, with tangible partnerships or new orders expected to provide the stock’s GTC follow-through. This scenario will see the Nvidia share price reclaim recent highs if the market is convinced that the inference roadmap will expand cycle durations.
Bear case: a reset of the company’s valuation (actualizing background market fears) or a risk-off environment, triggered by firming yields of a hit from China or competing hyperscalers, will trigger a selloff, even if the fundamentals remain strong.
Nvidia Share Price Forecast: Technical Outlook
The intraday charts show an emerging symmetrical triangle consolidation pattern, with price action trading both ways in a choppy manner, as described. Price is currently testing the triangle’s lower border at 181.95. A breakdown of this border will test the 180.00 support level (13 March low) initially, before the recent double bottom at 176.39 comes into play. Below this level, the 5 February low at 171.42 becomes the next pivot.
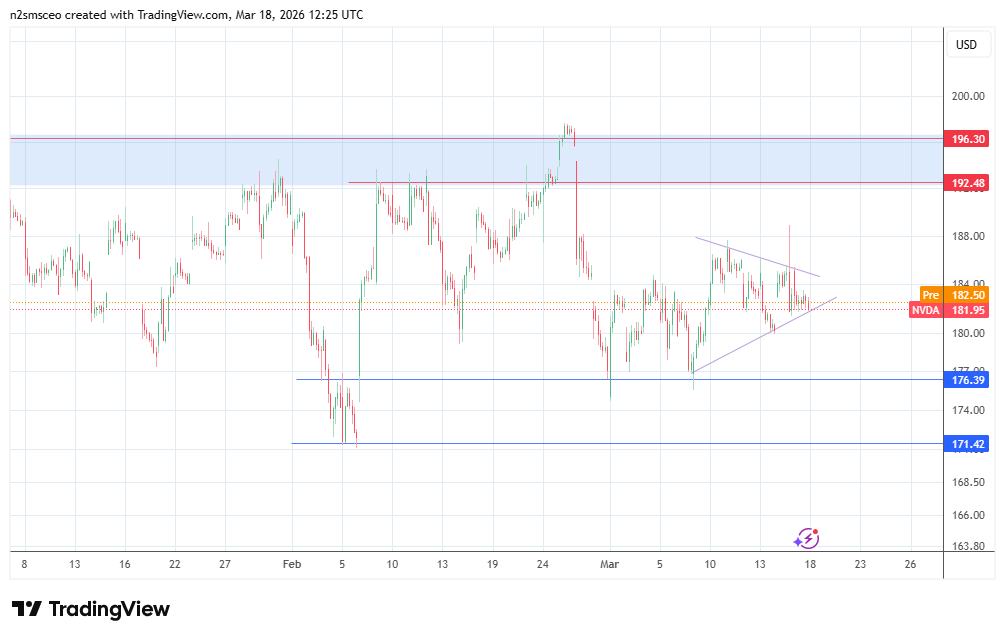
On the flip side, a bounce at the current border and a subsequent break of the upper boundary make a case for the bulls to push towards the recent peak at 188.00, before the 192.48 resistance and prior January 2026 highs become the next targets.