

- Adani Power shares surged over 2% on Tuesday, hitting a four-month high and extending a 13% weekly gain.
- The rally is fueled by a massive 1,600 MW contract win from MSEDCL and rising summer power demand.
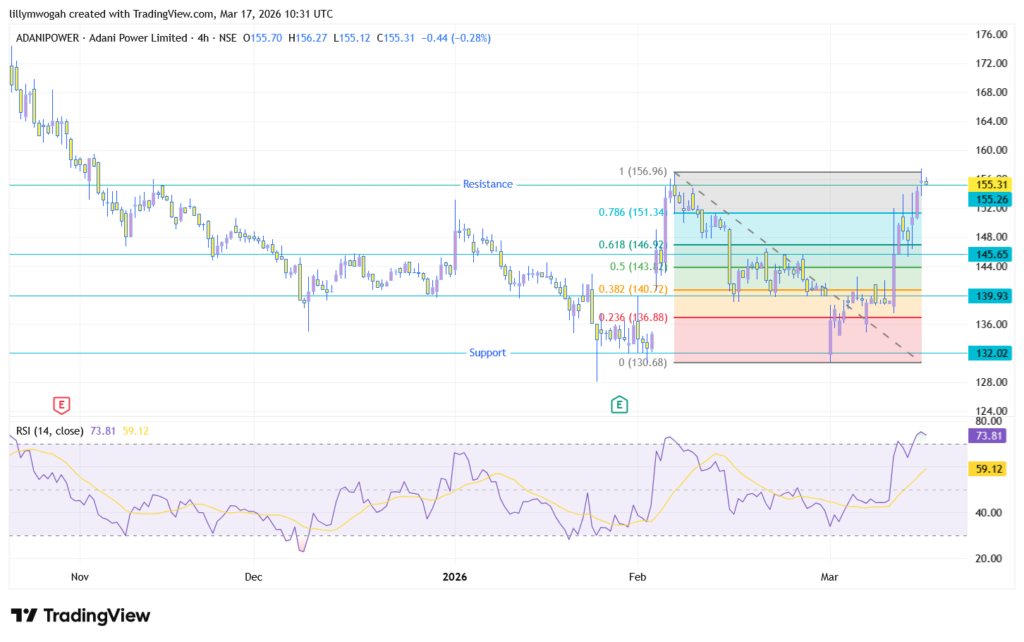
- Technical indicators remain bullish as the stock breaks out of a long-term descending trendline, supported by strong volume.
Shares of Adani Power continued their upward trajectory on Tuesday, outperforming the broader market as investors reacted to significant fundamental developments. The stock has gained 13% in just seven days, driven by a combination of strategic capacity expansion and seasonal tailwinds.
Why Adani Power Share Price Moved
The rally in Adani Power share price is largely driven by a major development: the company secured a Letter of Award (LoA) from the Maharashtra State Electricity Distribution Company (MSEDCL). This is a transformative deal that involves a 1,600 MW power supply from an upcoming ultra-supercritical thermal power project.
Under a 25-year Power Supply Agreement (PSA), operations are expected to commence from FY31 with a first-year tariff of ₹5.30 per kWh. This single order has significantly strengthened visibility for future revenues and long-term capacity utilization.
Furthermore, with summer temperatures expected to stay above normal levels, the outlook for electricity demand remains robust, providing a quiet but powerful backdrop for the stock’s ascent.
Adani Power Share Price: Performance Snapshot
The Adani Power share price has delivered exceptional returns across multiple timeframes, showcasing its resilience and growth trajectory:
| Timeframe | Performance / Return |
| Last 2 Sessions | 7.5% Gain |
| Past 1 Month | 7.5% Rise |
| Past 6 Months | 23% Gain |
| Past 1 Year | 52% Up |
| Past 5 Years | 789% Surge |
Even after this recent rally, the stock sits approximately 14% below its 52-week high of ₹182.75 (Sept 2025), having recovered significantly from its 52-week low of ₹94.41 (April 2025).

ADANIPOWER key technical trade levels to watch:
- Resistance: 156.96 This is the immediate floor. A break above it is needed to clear the path toward the yearly highs.
- Invalidation: 155.00 This is the “make or break” point for bulls. Staying above this keeps the short-term rally alive; falling below it signals a deep correction.
- Support: 145.65 Sellers are currently defending this level. This serves as the immediate floor; a drop below suggest the short-term rally is over.
- Next target: 161.85 If buyers reclaim control, these are the psychological levels to watch.
Adani Power vs Tata Power: Outlook for Utility Stocks
The technical breakout in Adani Power mirrors the bullish sentiment seen across the utility sector. With the India Meteorological Department predicting record power consumption this summer, the macro environment is providing a lift to the entire industry.
Much like the momentum observed in Tata Power, which has also been scaling generation capacity to meet industrial needs, Adani Power is benefiting from a broader sector re-rating. As the race for energy dominance in the private sector intensifies, both companies remain top-of-mind for investors looking to capitalize on India’s growing electricity demand.
The surge is primarily driven by a 1,600 MW thermal power supply contract from MSEDCL and expectations of record-high electricity demand during the upcoming summer months.
The stock reached a 52-week high of ₹182.75 in September 2025 and hit a low of ₹94.41 in April 2025.
With a 789% return over five years and a 25-year Power Supply Agreement in place, the company shows strong long-term revenue visibility, though technical support levels at 145.65 should be monitored.
