- Discover how the US Nonfarm Payrolls for October and November influenced market trends, the Dollar index, and Gold prices in this article.
The United States (US) Bureau of Labor Statistics is responsible for monitoring the monthly changes in payroll. The US Nonfarm Payrolls release represents the number of new jobs created in the US during the previous month in all non-agricultural businesses.
The US Nonfarm Payrolls figures are released on the first Friday of each month. The October and November NFP data have been delayed due to the federal government shutdown. During a shutdown, many BLS employees are temporarily laid off. This means that data collection, processing, and quality checks are paused.
Tuesday’s US employment report is unusual, as it covers data for both October and November. This article explores market expectations and the actual release of the US Nonfarm Payrolls for October and November, as well as the performance of the Dollar index before and after the release, along with Gold.
Market Expectations vs Actual Nonfarm Payrolls Release:
Economists were expecting that the US Nonfarm Payrolls would rise by 50,000 in November. while no consensus estimate for October. Most economists expected jobs to fall that month, with BNP predicting a decline of up to 100,000 jobs, according to Reuters. Alo market expectations were that the unemployment rate would increase by 4.4% in November.
The US Nonfarm Payrolls figures came in better than the market expectations for an increase of 50,000. The US Nonfarm Payrolls rose by 64,000 in November, as reported by the US Bureau of Labor Statistics.
The report also cited that Nonfarm Payrolls declined by 105,000 in October. The NFP figure shows that the unemployment rate climbed to 4.6% in November, higher than market expectations of 4.4%.

The US Dollar Index Came Under Pressure Amid NFP Release:
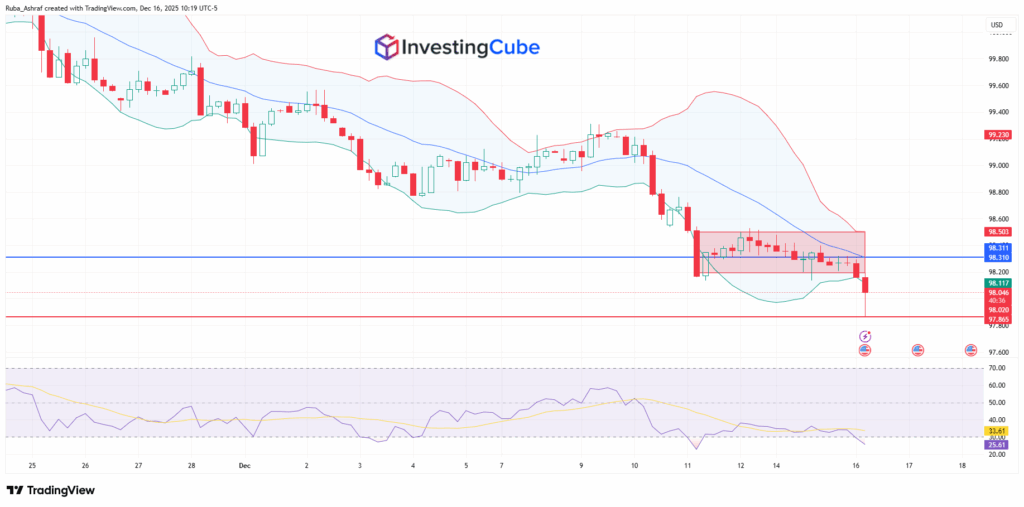
The US Dollar Index dropped to its lowest level since early October, falling below 98.00. This was an immediate reaction to the Nonfarm Payrolls data. Selling pressure has pushed the dollar index toward 97.90 at the time of writing. Investors are expecting a dovish Federal Reserve and are anticipating a new rate cut in the upcoming meeting, which keeps bearish momentum intact.
Before the data release, the Dollar Index had been consolidating above 98.15. Once the data was released, sellers took control, pushing the price below the lower Bollinger Band at 98.12. The bearish momentum drove the price down to a low of 97.86 as an immediate reaction.
At the time of writing, an upward correction is underway, bringing the price back toward the resistance level of 98.00. A decisive breakout above this level could pave the way toward the middle Bollinger Band. The RSI confirms that the Dollar Index is oversold and may be poised for an upward correction.
Investors Eye Dovish Fed but Gold Struggles to Break Higher:
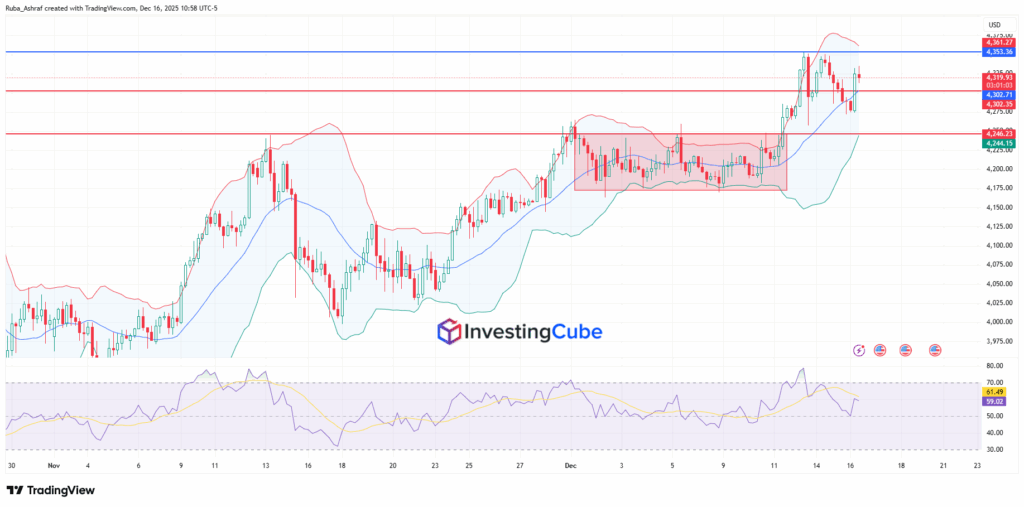
The price action shows the recent breaking above a consolidation range around 4,175-4,245 and touching the upper Bollinger band near 4,361, signaling bullish momentum with limited upside. The support lies around 4,302- 4,246, while the resistance is near 4,353-4,361.
Te reltive strength Index has slipped back toward the neutral 50 area. It reflects fading bullish momentum. It confirms that gold may remain in short-term consolidation before attempting another bullish move.