

- Crypto prices dip after CPI report despite bullish headlines. BTC, ETH, XRP, and DOGE chart key levels as traders await fresh momentum.
Thursday’s price action sent a wave of chill through the crypto market. Bitcoin faltered below $108K, dragging Ethereum, XRP, and Dogecoin into the red zone. While the U.S. CPI read softer than expected, the lack of an immediate Fed response has created a vacuum. Here’s how the charts stack up going into the weekend.
With total crypto market cap falling back below $3.35 trillion, the market lost its short-term bullish footing.
Bitcoin Price Falls to $107K Despite $800M Treasury Plan and Russell 2000 Tailwind
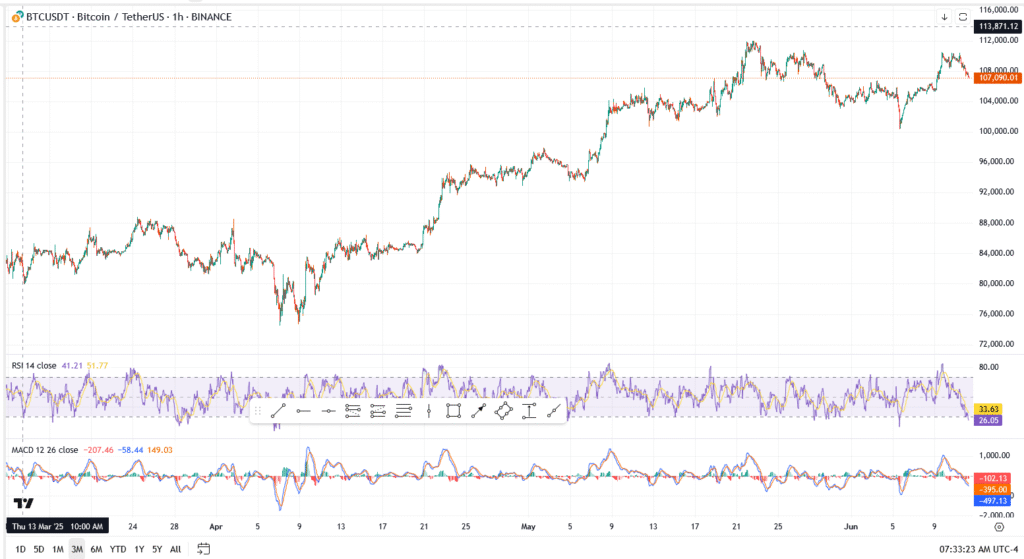
Bitcoin was hovering around $107,090 in Thursday trade, slipping despite two big catalysts hitting the wire. Mercurity Fintech’s announcement of an $800 million BTC treasury strategy, along with its entry into the Russell 2000 index, had the potential to boost sentiment, but the market wasn’t biting.
BTC Key Levels (1H Chart)
- Support: $106,200 · $104,800
- Resistance: $110,000 · $113,870
XRP Price Stalls as Market Awaits SEC Status Report Due June 16
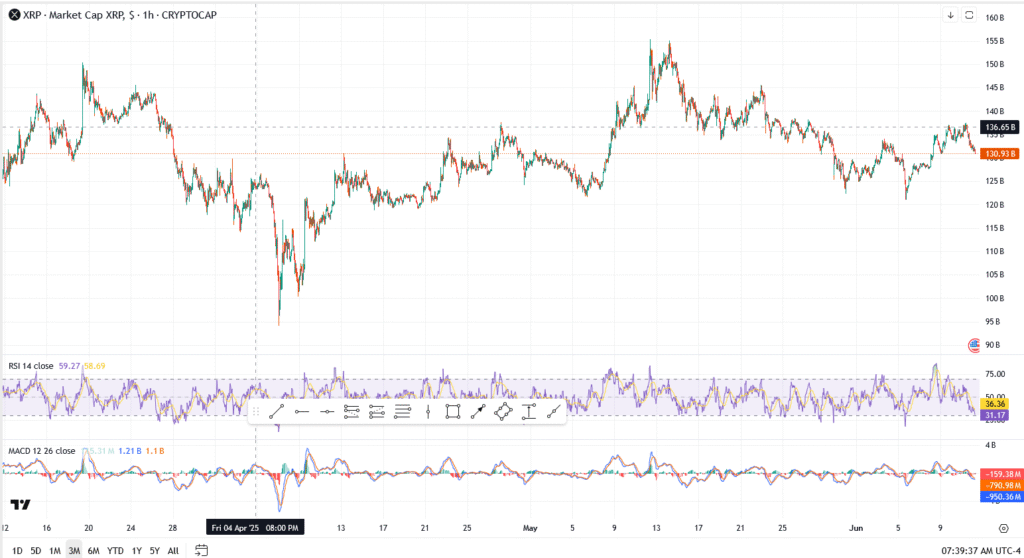
XRP is holding steady near a $132 billion market cap, caught between legal anticipation and market indecision. The long-awaited Ripple vs SEC case has not ended, contrary to speculation. In fact, no ruling is expected this week. The real deadline to watch is June 16, when the SEC is scheduled to file a status update with the court.
Despite low volatility, activity under the surface is heating up. Derivatives data shows a 9.6% jump in trading volume, but open interest dropped 2.6%, a signal that some traders are exiting positions rather than doubling down. It’s caution, not confidence, driving sentiment now.
On-chain metrics remain neutral, and whale wallets have not made aggressive moves. It’s clear the market is waiting for clarity, not reacting on impulse.

XRP Key Chart Levels (2H Market Cap)
- Support: $126B · $118B
- Resistance: $135B · $143B
XRP is now in a pressure cooker. If the June 16 filing shows progress, or any softening from regulators, bulls may finally have a breakout window. Until then, expect tight price action and no real conviction in either direction.
Ethereum Futures Hit $20B as Price Pulls Back From $2,800
Ethereum is cooling off a bit. Price hit resistance just shy of $2,800 and has been drifting since. Not a breakdown, just a breather. After a solid run-up in early June, bulls look tired, and the chart is showing it.
But under the surface, interest is still building. Futures open interest just crossed $20 billion, a new all-time high. That’s not just traders getting greedy. It’s leverage piling in, and when leverage builds, so does risk. The question now is whether ETH can hold this zone or if overexposure triggers a shakeout.
Meanwhile, ETH-focused ETFs are quietly catching up to Bitcoin inflows. Institutions are nibbling, and that’s probably why the floor hasn’t fallen out despite resistance holding strong.
Key Levels to Watch
- Support: $2,735 · $2,555
- Resistance: $2,800 · $2,880
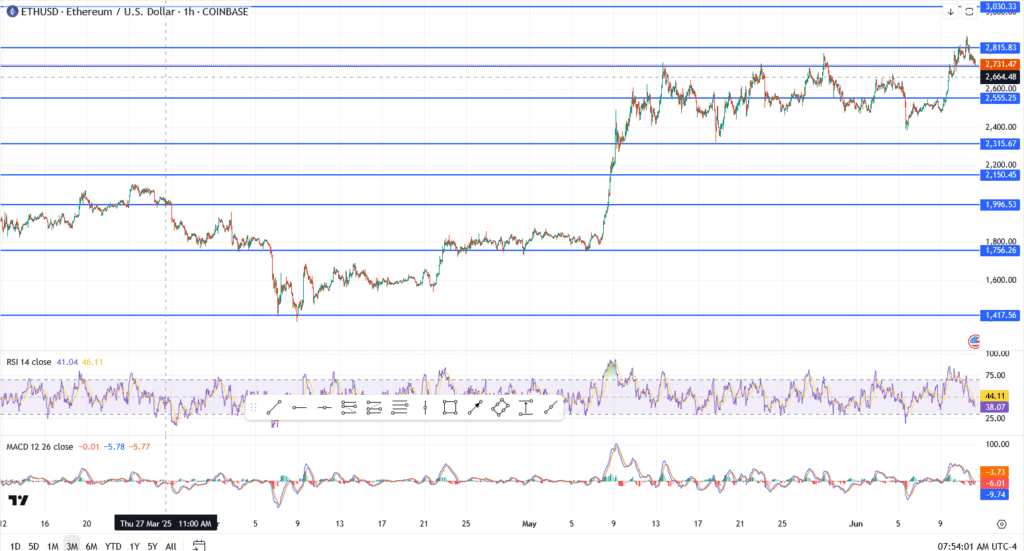
This is where things tend to stall. If bulls push through $2,800 cleanly, we could see a sprint toward $3,030. But if this stalls and dips under $2,735, the market may unwind a bit before it resets. No panic, just pressure.