

- Silver price forecasts continue to be dominated by war headlines, the oil risk premium and inflation fears.
Silver Price Forecasts: Live Chart and Current Setup
Silver price forecasts continue to be dominated by the interplay among the oil shock risk premium, US bond yields, inflation expectations, and the repricing of the Fed Reserve rate pathway.
This is indeed a complex interplay of factors that has led silver to trade within a high-volatility, post-liquidation environment. Spot silver currently trades at $73.02/oz, after a strong pop on Monday that is extending into Tuesday’s London session. Monday’s 2.18% upswing is now being followed by a 1.24% intraday rise, fueled mostly by Friday’s 10-day pause in the bombing of energy sites in Iran, announced by US President Donald Trump. This announcement allowed crude oil prices to cool from last week’s high of $114.35 to the current price mark of $106.61.
This scenario saw a slight cooling in US bond yields and the US Dollar as inflation fears dissipated, allowing precious metals to gain ground vs the greenback.
Silver Price Forecasts: Macro Drivers
1) War-risk bid vs “higher-for-longer” rates narrative
Higher energy prices and inflation fears have reduced expectations of the Fed easing. This constitutes a capping headwind for silver, a non-yielding industrial metal. The March drawdown in metal prices is explicitly linked to inflation fears, which could keep interest rates higher for longer. Safe-haven demand is currently not playing a very active role as long as the war risk premium drives inflation fears and the higher-for-longer rates narrative.
2) Positioning/liquidation dynamics
Silver is trading in a volatile two-way street. The rebound-and-fade pattern seen day to day for a while now continues, even as silver snapped a nine-day losing streak on Monday (the longest in nearly 4 years). Within the losing stretch, silver shed 22%, forcing smart money to derisk positioning
Silver Price Forecasts: Important Notes for the Week
Three catalysts are expected to drive this week’s price action.

- Iran war headlines → oil → US real yields: War headlines that showcase escalation will keep oil prices elevated, leading to inflationary fears and tightening of financial conditions. This will cap silver prices.
- USD direction: Inflation fears will stoke a “higher-for-longer” narrative, driving US bond yields higher and the USD stronger. If the greenback remains on bid, any silver rallies will be fragile.
- Test of key support near $70: Barron’s notes that the $69.27 price level served as a recent settlement point following the long losing streak. This price level is expected to serve as the key price floor that the bears will test.
Weekly Silver Price Forecast Scenarios
Base case: the silver price remains range-bound with violent swings, as long as markets remain subject to the current geopolitical risk premium. Silver is expected to whipsaw between relief rallies and macro-forced pullbacks.
Bull case: oil stabilizes or even retraces amid de-escalation of the geopolitical situation, with softening of US real yields and the US Dollar. This will promote more stable, safe-haven demand that can drive a noticeable, durable rebound from current levels.
Bear case: a renewed oil spike and higher US real yields driven by higher inflation expectations can make a case for further liquidation of silver longs. A break below the $69 support can trigger a sustained selloff into fresh multi-month lows.
Silver is currently not trading in a classical safe-haven trend but in an oil-shock regime. This regime features choppy trading within defined boundaries, with relief rallies followed by macro-driven pullbacks as oil prices fluctuate with war headlines.
Silver Price Forecast: Technical Outlook
Silver is approaching the 20 March and 25 March highs at 74.61, following clearance of the 71.01 resistance barrier. If the bulls reclaim this level, the next upside target of choice is 79.30, the prior low of 3 March and 13 March 2026.
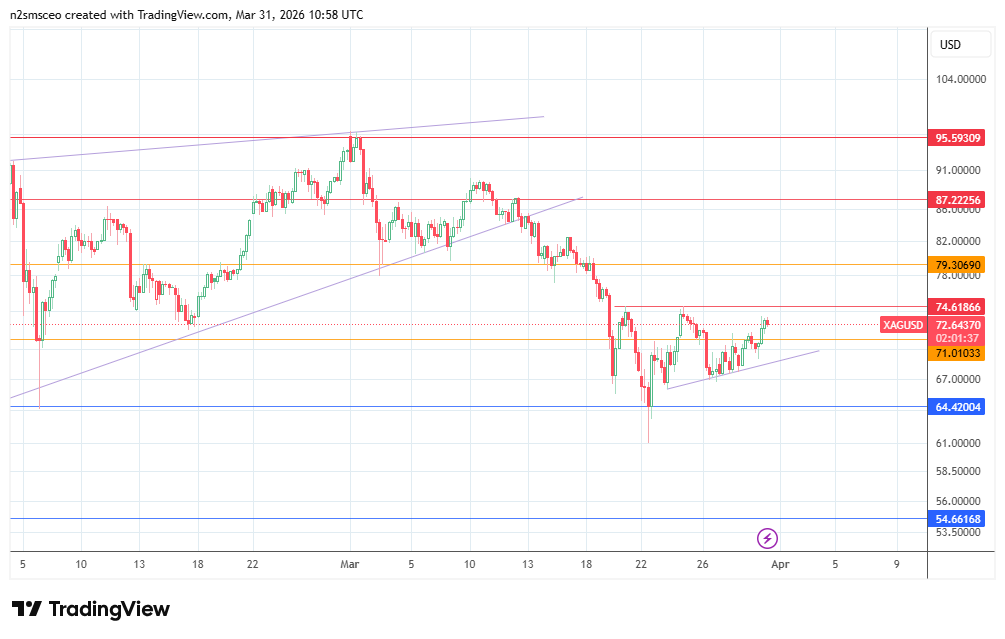
However, a breakdown of 71.01 brings the asset price into confrontation with the trendline support. If this trendline is degraded, the pathway towards the 64.2 support and prior low of 5 February 2026 becomes clearer.
