ATOM price is looking very bullish after a massive rebound from its yearly lows. The smart contract cryptocurrency can thank Bitcoin price for this V shape recovery. However, after a 13.4% surge in 1 week, many analysts are expecting a minor pullback.
It is also likely that the ATOM crypto won’t retrace and go straight to $7.6 which is the next major resistance. This is because it has already closed a couple of days above $7.08 resistance level. This has put a move towards $7.6 on the cards before any significant correction.
On Friday, altcoins are correcting as the Bitcoin price hovers around $34,100 level. The correction in the biggest cryptocurrency by marketcap has caused the altcoin markets to take a breather. Neverthless, the Total 4 market cap which is a mesure of altcoin dominance increased 0.3% today.
ATOM price fell below the $7 level but got back up very quickly. This move could be a faekout to trap the bears. On the daily timeframe, the altcoin is still down 0.71%. Despite a strong push from the yearly lows, the daily RSI still have a lot of room to grow.
ATOM Price Outlook
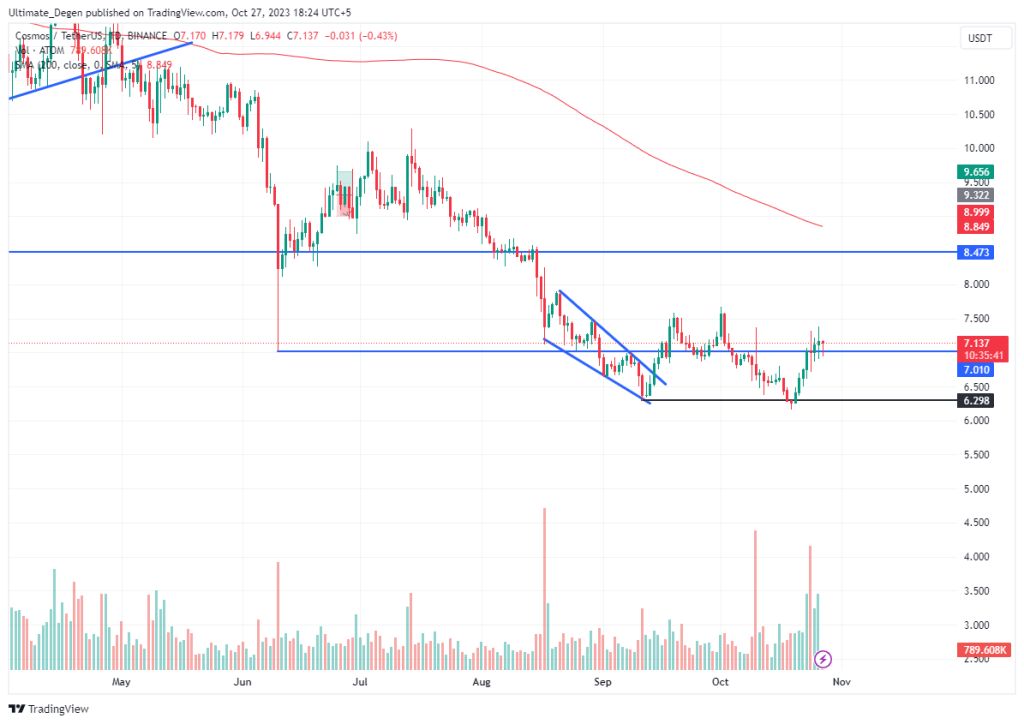
As evident from the following chart, the recent brekaout above $7 resistance has given bulls a lot of momentum. Even though the bears are still pretty much in the game, the bulls have the odds in their favor. Therfore, I expect a retest of the $7.6 resistance in the coming days, if bulls hold the $7 support.
A weekly closure above $7.6 will be confirmation of the bullish ATOM price prediction. This will be a major bullish reversal signal and I expet the price to skyrokcet from there with the first bullish target of $8.47. This may follow by a retest of the 200 daily moving average around $8.85.
ATOM Crypto Chart