

What are the silver price forecasts for the week?
Silver continues to trade in a highly volatile market environment and is experiencing a macro-driven drawdown. Specifically, the Fed’s decision to keep rates steady, raise its inflation outlook, and adopt a wait-and-see approach in response to the oil price shock is responsible for the downturn in silver and gold prices. Silver is now trading like an asset sensitive to rates and risk sentiment rather than a hedge against global crises.
Spot silver prices fell nearly 5% to close the week at $67.91, posting yet another weekly loss as US bond yields firmed further following Wednesday’s FOMC decision.
A Wall Street Journal report indicates that the move to the south has been quite violent. Silver has lost more than 20% over the past seven trading days, indicating a major shift in sentiment toward the metals market.
Silver Price: What’s Driving It Right Now?
1. Oil shock
Higher oil prices resulting from shipping disruptions in the Strait of Hormuz are now feeding global inflation expectations. The actions of several central banks, keeping rates unchanged and indicating there is no hurry to cut rates, have shifted investment flows from non-yielding metal assets to riskier assets. For silver prices, this is now a major headwind.
2. Higher USD Yields
The decline in silver prices, driven by a stronger US Dollar and higher bond yields, reflects a shift in investment flows from non-yielding metals to interest-yielding assets such as US Treasuries. Higher bond yields are making US Treasuries more attractive at the moment.
3. Portfolio Repositioning
Hedge funds and commodity trading advisors (CTAs) are cutting their exposure to metal assets amid broader metal weakness. Silver is regarded as a high-beta asset that tends to overshoot in both directions during directional moves in gold prices.

Silver Prices: This Week’s Catalysts
1. Oil Price Pathway: The rise in oil prices remains a risk premium to silver prices via the heightened inflationary expectations and reduced rate-easing expectations. The question, therefore, is: will this risk premium accelerate further, or will it fade? Acceleration will keep silver prices capped, while a fade will re-ignite demand.
2. USD and Treasury Yields: If US Treasury yields continue to rise, silver prices are more likely to keep declining. However, silver has the potential to rebound sharply if yields retreat or stabilize.
3. Risk Appetite/Growth Fears: The broader weakness in industrial metals is also a result of global growth fears. Silver is regarded as an industrial metal. Business conditions in manufacturing tend to worsen when oil prices are higher, as higher oil prices increase business costs and can cause margin compression for companies. This factor, in turn, can cause silver prices to decline over time.
Silver Prices: Weekly Forecast Scenarios
Base case: prices remain range-bound, albeit in a violent two-way trade characterized by sharp intraday swings. The highest-probability pathway is for silver prices to remain choppy, without forming a clear trend. This is expected to remain given the extent of liquidation and the ongoing uncertainty, especially as oil prices remain high and unstable.
Bull case: a rebound in silver prices, triggered by a cooling in oil prices and a loosening of US bond yields. The rebound can be sharp because the environment is currently characterized by reduced positioning and compression of risk appetite.
Bear case: the bear case sees a further extension of the decline, triggered by a renewed oil spike, firmer US yields, and heightening inflation fears.
Silver is expected to trade this week as a high-beta macro instrument, with oil prices determining the inflation expectations and US bond yields, which in turn will determine the direction of the US Dollar within the XAG/USD pair.
Silver Price Forecasts: Technical Outlook
The wedge pattern has resolved as expected following the break of the lower border and the 79.30 support. The breakdown of this support and the 71.01 pivot below has opened the pathway towards the 6 February low at 64.42. This move may result from a fading rally towards the 71.01 level, which has now become degraded support and is acting as resistance.
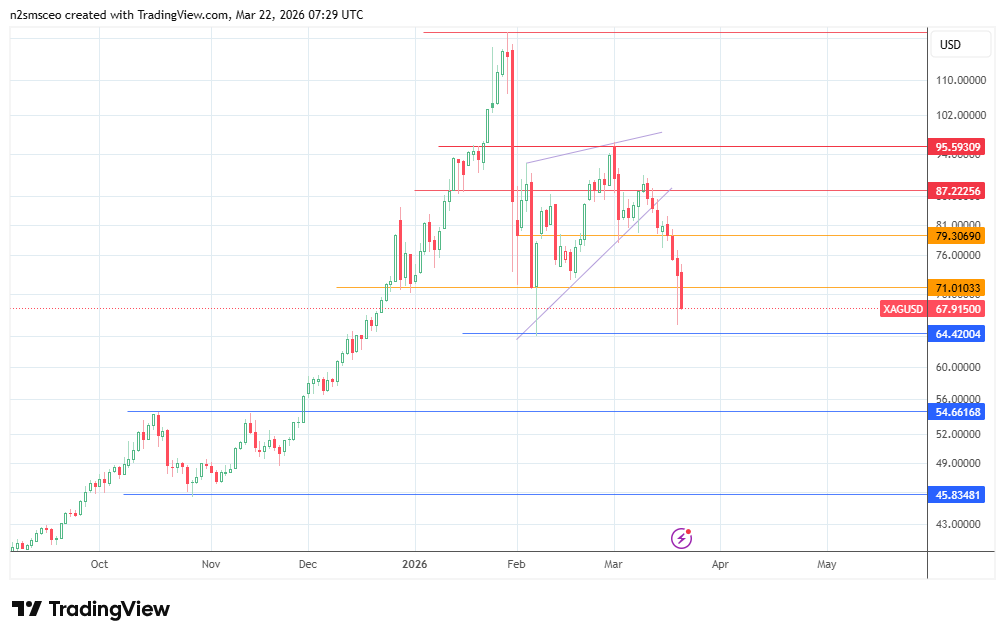
On the flip side, we need to see a break of 79.30 for the bulls to reclaim the most recent swing high of 10 March at 87.22. Above this barrier, a reclaim of the 2 March high at 95.59 becomes a potential scenario.
