

- Gold price crashes to 4612 dollars as hot PPI data and a hawkish Fed hold trigger a massive liquidity flush across the market on March 19
- Hot inflation and high yields weigh on gold as US producer prices jump 0.7% and the Federal Reserve projects only one rate cut for the remainder of 2026
- Institutional selling overrides war premium with traders liquidating gold to cover margin calls while the US Dollar remains the preferred safe haven during the Iran war
The gold market is navigating a turbulent “institutional repricing” as we conclude the third week of March 2026. Despite the escalating Middle East conflict, gold has betrayed its typical safe-haven role, crashing nearly 13% from its February highs.
As of Friday, March 20, 2026, spot gold is desperately fighting to hold the $4,612 level, a sharp decline from the $5,300 range seen earlier this month. The metal faced a brutal 4.5% one-day drop following a series of high-impact economic reports that have fundamentally shifted the global interest rate outlook.
Gold price outlook: Inflation shock and hawkish fed drive Dollar strength and pressure bullion
The week of March 16 began with gold holding a firm “war premium” near $5,200 per ounce. However, the narrative shifted violently on Wednesday, March 18, 2026, with the release of the Producer Price Index (PPI).
The report showed headline inflation rising by 0.7% month-over-month, more than double the consensus expectation. This data confirmed that inflationary pressures are re-accelerating even before the energy shock from the Strait of Hormuz closure is fully reflected in the numbers.
Following the PPI release, the Federal Reserve concluded its FOMC meeting by holding interest rates steady at 3.50%–3.75%. More importantly, the Fed’s Economic Projections (SEP) revealed a hawkish pivot, with officials now expecting just a single quarter-point cut for the entirety of 2026.
This “higher-for-longer” stance sent US Treasury yields and the US Dollar Index (DXY) skyrocketing, creating a direct and powerful headwind for non-yielding assets.
Why gold is falling despite rising middle east tensions
It remains a paradox for many investors that gold is falling while a regional war intensifies. The primary driver is a “margin call” liquidation cycle. As energy prices spike and global equity markets face volatility, large institutional players are selling their most liquid winning asset, gold, to raise cash and meet collateral requirements elsewhere.
Additionally, the rapid rise in real yields has made the opportunity cost of holding gold too high for short-term speculators.

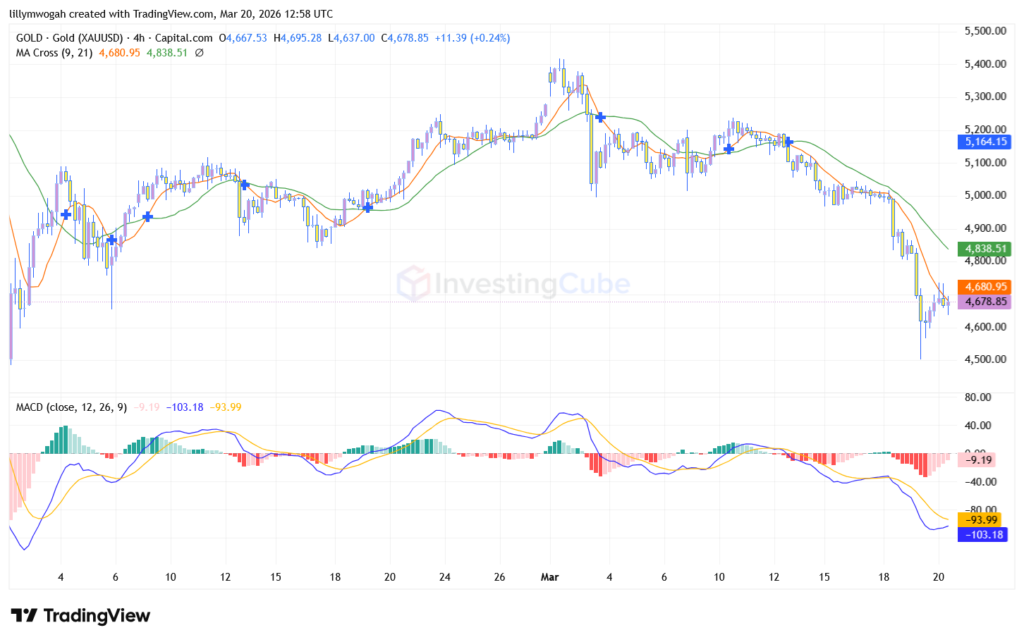
Gold weekly technical chart analysis
Looking at the technicals from this week’s price action, the damage to the “bull case” is significant but potentially oversold.
- The double top breakdown: Gold formed a clear double top near the $5,420 level earlier this year. This week’s plunge confirmed the breakdown of that pattern, with the “neckline” at $4,900 failing to hold on a daily closing basis.
- Moving average convergence: Gold has sliced through its 50-day simple moving average (SMA) of $4,961. This level has now flipped from a reliable floor to a heavy overhead resistance zone that bulls must reclaim to stop the bleeding.
- Support zones: The current price of $4,612 is sitting right on a major psychological floor. If this fails, the next target for bears is the 100-day SMA at $4,470, which represents the “ultimate value zone” for long-term buyers.
- RSI oversold: The Relative Strength Index (RSI) has dipped into the 30 range, suggesting that while the trend is bearish, the selling may be exhausted in the immediate short term.
Gold price prediction: What to expect next week
Looking ahead to the week of March 23, the $4,600 support level is the “line in the sand” for bulls. A successful defense of this area could lead to a technical relief rally back toward $4,850 as buyers look for “oversold” entries. However, if the US Dollar continues its rally toward the 100.00 mark, gold could be exposed to a further slide toward the 100-day SMA near $4,470.
Despite the current carnage, long-term forecasts from major investment banks like J.P. Morgan and Goldman Sachs remain remarkably optimistic. Analysts point out that the structural drivers for gold, central bank diversification and the ongoing shift toward “real assets”, have not changed. J.P. Morgan maintains a base case target of $5,055 for Q4 2026, suggesting that the current crash might be a strategic “buy the dip” opportunity for physical stackers once the initial liquidity panic subsides.
FAQ: Gold market crash 2026
While gold is a safe haven, it is also a highly liquid asset. During extreme market stress, institutional investors often sell gold to cover losses in other sectors (margin calls) or rotate into the US Dollar, which is currently yielding more due to high interest rates.
The Fed held rates steady but adopted a “hawkish” tone, signaling that only one rate cut is likely in 2026. This increased the strength of the US Dollar and Treasury yields, both of which traditionally move in the opposite direction of gold.
High PPI (Producer Price Index) indicates that inflation is still “sticky.” This forces the Fed to keep interest rates high for longer, which makes non-interest-bearing assets like gold less attractive to traders compared to Treasury bonds.
Technically, gold is “oversold” near the $4,612 level. While the short-term trend is bearish, long-term analysts suggest that prices near $4,500 represent strong value for investors looking toward late 2026 recoveries.