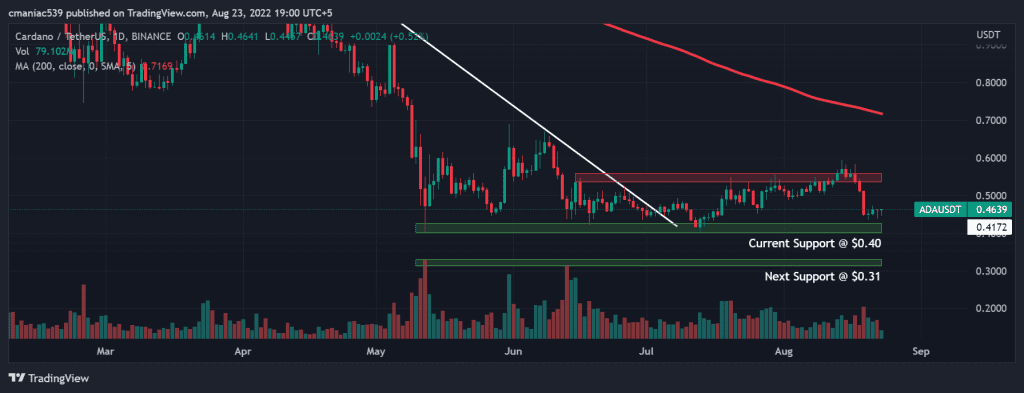
Our Cardano price prediction is playing out exactly as predicted. ADA price is still hovering within the same range described in last week’s article. The price has been trading inside the $0.42-0.54 range for the past three months. After another failed breakout attempt last week, the price is again retesting the range lows.
Most altcoins tanked at the weekend as the BTC and ETH prices took a nosedive. The rejection of the two biggest assets from key resistances has shaken investor confidence. The corresponding downtrend in the equities has further validated this sentiment.
At the time of writing, Cardano price is trading at $0.46. The native asset of Charles Hoskinson’s smart contract platform is $0.2% up from yesterday. ADA has immensely underperformed during the past 3 months compared to its biggest competitor ETH. The price of Ethereum’s native asset has almost doubled during this time. You can buy Cardano and other coins by signing up on Binance.
According to Cardano news, only 31% of the network’s SPO nodes have upgraded to v1.35.3. However, for the implementation of the much-anticipated Vasil hard fork, 75% of nodes must be on the newest version. This has fuelled the rumors of another delay in the big upgrade, which has already been postponed many times.
Cardano Price Prediction
The ADA USD price chart appears to be range bound, as described at the start of this article. However, the prolonged sideways price action has bored investors, with many already moving to other assets. If you’re a swing trader, it’s better to wait for a breakout in one direction before opening any position.
A daily closure below the range of $0.42 would make Cardano price prediction bearish. On the other hand, a reclaim of the $0.54 level is expected to result in a huge bullish move. In both cases, the tights stop loss must be placed to avoid getting stuck in a fakeout.
Cardano Daily Chart