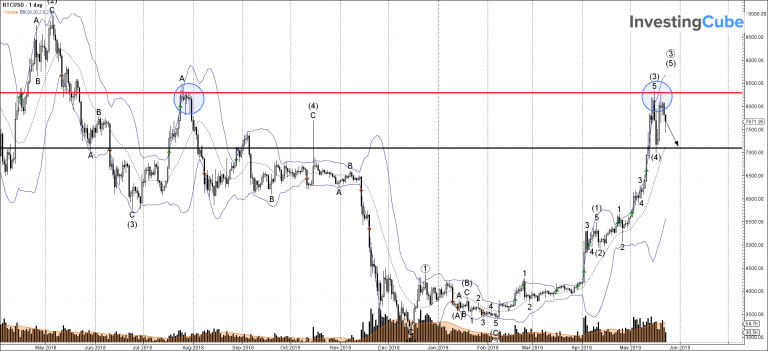
Bitcoin recently made two failed attempts to break above the strong multi-month resistance level at $8290. The same level stopped Bitcoin bulls in their tracks in July 2018. See point A in the chart below. The resistance zone near the resistance level at $8290 was strengthened by the upper daily Bollinger Band.
The last downward reversal from $8290 created the daily Japanese candlesticks reversal pattern Long Legged Doji – which was preceded by the daily Bearish engulfing reversal pattern when Bitcoin tried to break above the resistance level 8290.00 earlier this month. Both of these reversal patterns indicate a strong probability of Bitcoin to correct to the low of wave (4) at $7000.