
Not much has changed since our last week’s ANKR price prediction. The price is still trading in the same range without any signs of a breakout. ANKR crypto is having a sideways price action amid a minor correction in most altcoins.
During Thursday’s trading session, the Bitcoin price broke its Monday lows. This triggered a market-wide sell-off as many investors started to book some profits on their bottom buys. At the time of writing, ANKR price is trading at $0.0318 after gaining 1.05% within the last 24 hrs.
DeFi Llama has shown a more than 6% decrease in TVL of ANKR protocol since the start of the week. The constant decrease in TVL since November 2021 could be attributed to the low price of the ANKR coin and the reduced DeFi activity on Ethereum.
According to ANKR news today, the project is sponsoring Canada’s biggest cryptocurrency and blockchain event, Blockchain Futurist Conference. This project would also be a sponsor in ETHToronto.
ANKR Price Prediction
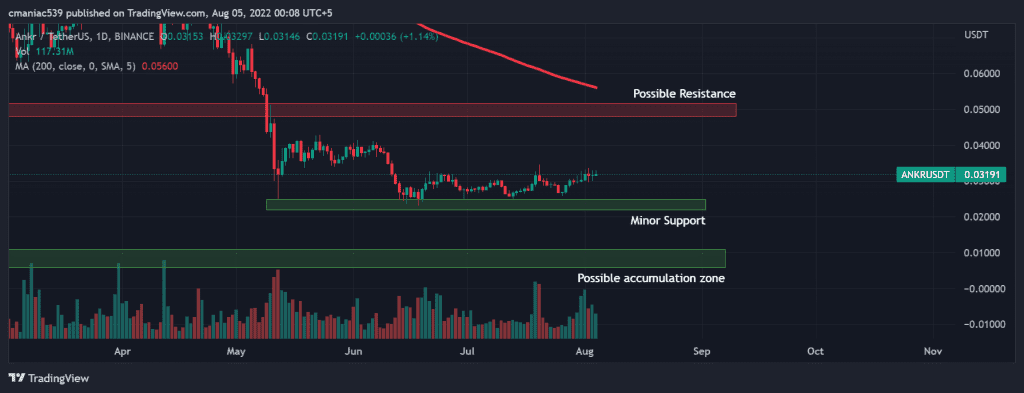
A lot has happened in the crypto world in the past few weeks. Nevertheless, the ANKR USD chart has kept on trading sideways. This bearish accumulation might pave the way for further upside only in case of a breakout. The price appears to range between the $0.04 and $0.025 levels. A breakout of this range in either direction might follow by a huge impulse wave.
If the price loses the $0.24 level, the next stop could be the $0.011 level. However, this bearish ANKR price prediction might be out of the window if the price flips the $0.04 level into support. Another major factor affecting the DeFi coin’s price action is the stability of ETH and BTC prices. Therefore, a recovery in ANKR is only likely if the overall crypto market recovers.
ANKR Daily Chart
If you want to trade the above-mentioned breakouts, then the best place to buy is Binance. It is also recommended to subscribe to InvestingCube’s Premium S&R Levels to stay updated on different trade setups.