- Summary:
- In this article I will try to compile a collection of factors that will allow us to determine the Fed's stance at its next meeting, one key piece of information will be the US inflation rate, but it is not the only one.
In this article I will try to compile a collection of factors that will allow us to determine the Fed’s stance at its next meeting, one key piece of information will be the US inflation rate, but it is not the only one.
For example, last Friday’s employment report makes things difficult for the Fed. An upward adjustment in wages is taking place, while the labour market is showing signs of strength again, with NFP payrolls at 253k, much better than expected at 180k.
With these data, the US unemployment rate falls to decades low of 3.4%, below the 4% unemployment rate that was considered residual.
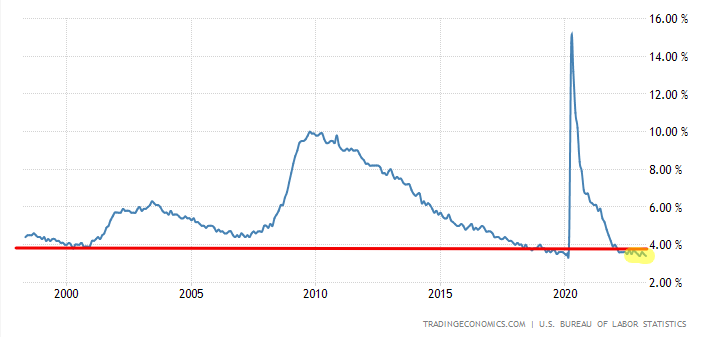
It should not be forgotten that in the two previous periods, the NFP had shown some weakness, a factor that surely fuelled the Federal Reserve’s doubts about continuing with its rate hike policy.
The dilemma for the Fed now is whether, with a resilient labour market and rising wages, these are not clear signals that tight monetary policy should continue, otherwise they will be exposed to a future increase in the inflation rate.
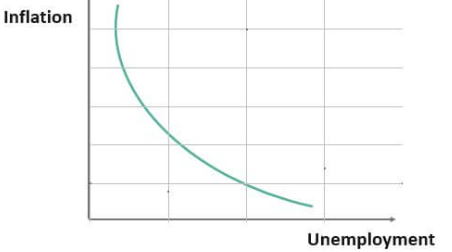
The Philips Curve Case.
On the other hand, a historically low unemployment rate ensures that inflation will not disappear according to the Philips curve.
Debt ceiling.
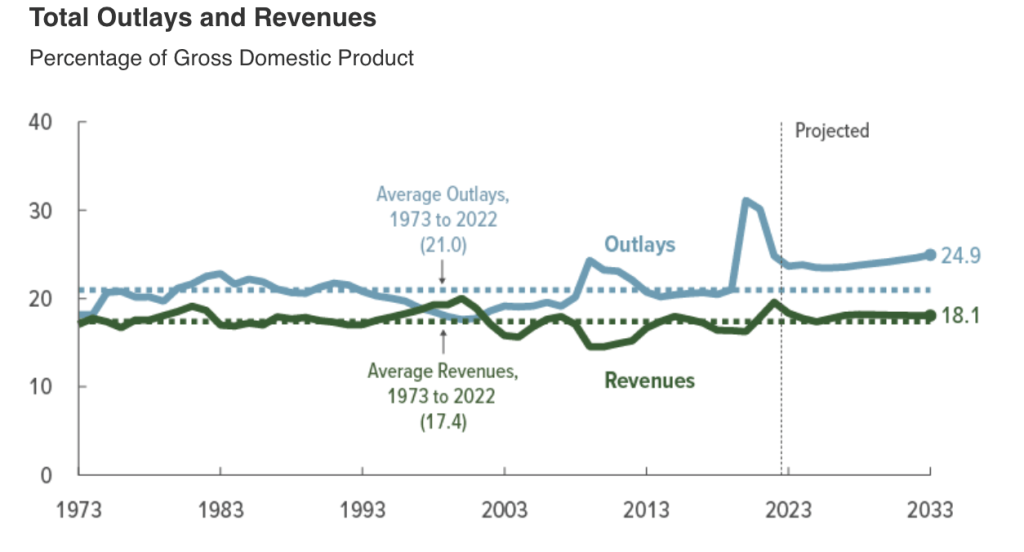
In addition, we have the problem of the fiscal ceiling in the US. It is true that traditionally, Democrats and Republicans have agreed to expand this fiscal limit at infinitum. But the warnings being issued by the US treasury chairwoman are exceptionally alarming, and US fiscal deficit rates are at levels never seen before.
Last week’s US debt auctions launched interest rates of 6% on one-month US bonds, clearly evidencing the investing public’s fears of US default risks, something unthinkable just a few years ago. Never in history has spending what you don’t have been a good idea.
Since 2000, the divergence between US government revenues and expenditures relative to gross domestic product has skyrocketed. The US is in a deficit spiral, as Donald Trump pointed out at the time.
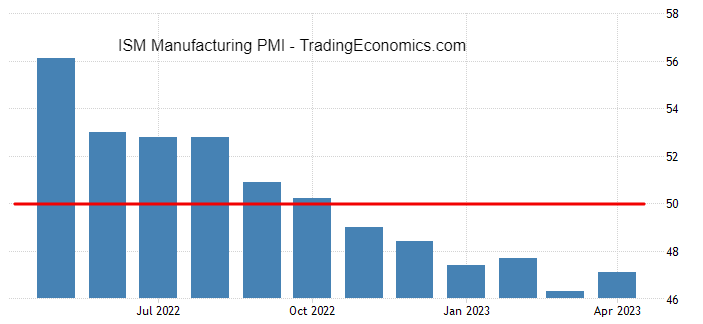
Contradictory Messages.
The US PMI industrial activity indicator shows for the fourth consecutive month figures below 50, indicating a contraction in industrial activity.
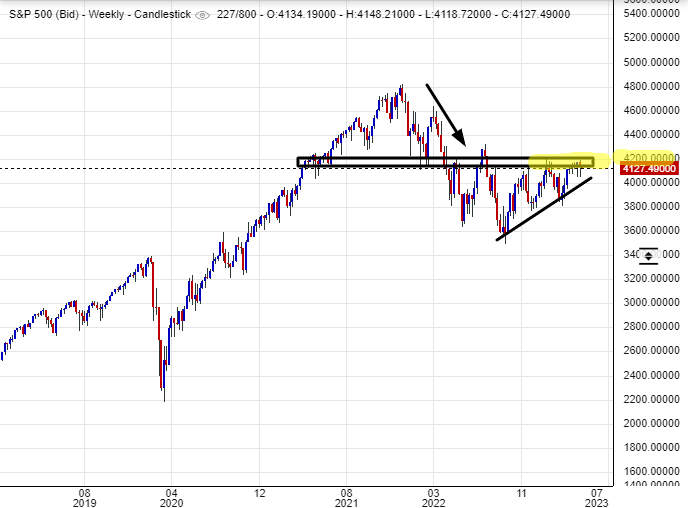
Market view.
For all the above mentioned in this article, the SP500 chart view becomes extremely sensitive, inviting absolute caution from bullish investors, as with such contradictory signals on the horizon, and a market with obvious resistance to further rallies, the chances of a price contraction should not be underestimated.
Please remember that this article is not intended to advise or influence the operating judgement of any reader. Financial markets involve high risk, please consult your financial advisor before investing.