The Unilever share price continues to trade in a very tight range, with this week’s price action forming a flag consolidation pattern. This follows a lack of powerful fundamental triggers for price action on the stock as traders await the subsequent earnings call on 28 April.
This earnings report covers the 1st quarter of its 2022 fiscal year and comes off a stellar performance in the Q4 2021 report, where the company earned 1.48p per share, beating estimates of 1.40p. The market consensus for revenue is for the company to pull in 14.16 billion pounds in revenue.
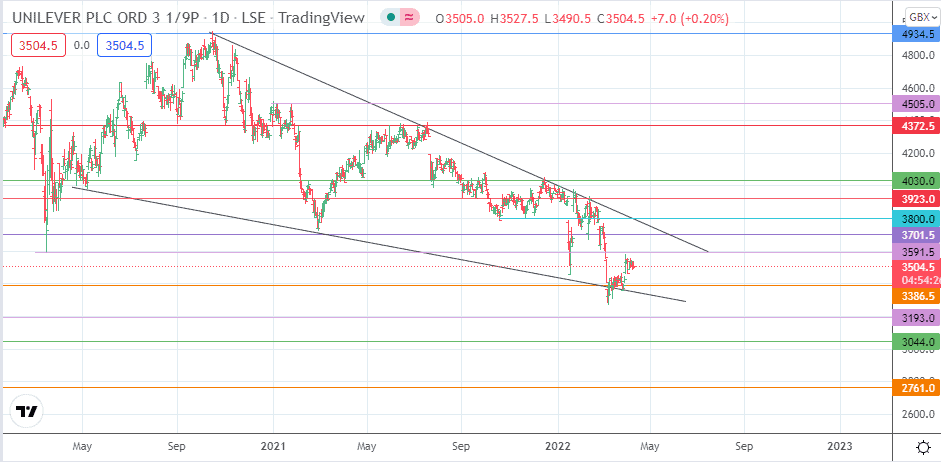
The price picture on the daily chart indicates that the recovery bounce off the 3386.5 support, where the wedge’s lower border lies, has stalled at the immediate upside barrier. The subsequent price activity has formed a small bullish flag, which will need to end with a break of the 3591.5 resistance to continue the march towards the wedge’s upper border. As of writing, the Unilever share price was up by 0.38%.
Unilever Share Price Outlook
The falling wedge on the daily chart gives an overall idea of the expectation of future price moves, pointing to a potential breakout and subsequent push to the measured move’s completion at the 4505.0 resistance (30 December 2020 and 28 January 2021 highs).
The completion of this move requires the bulls to uncap the resistance levels at 3800.0, 3923.0 (16 October 2018/31 January 2019 highs), 4030.0 (17 February/13 December 2021 highs), and 4372.5 (15 June 2021/23 July 2021 highs). The 3591.5 and 3701.5 resistance barriers are also contained within the wedge to contend with.
On the other hand, a failure of price activity to take out the resistance at 3591.5 could lead to a pullback move that targets 3386.5. If the bulls fail to protect this support, a decline towards the 31 January 2017 low at 3193.0 looks certain. Other targets to the south include the 3044.0 support (1 December 2016 low) and 2761.0. Price deterioration below 3386.5 invalidates the pattern.
Unilever: Daily Chart
Follow Eno on Twitter.